AI/ML フォーキャスト

AI/ML フォーキャストのためのインテリジェント ソリューション

精度の高い AI ドリブンな需要フォーキャストにより変化を先取りし、将来に備えて柔軟かつ強靭な体制を維持します。
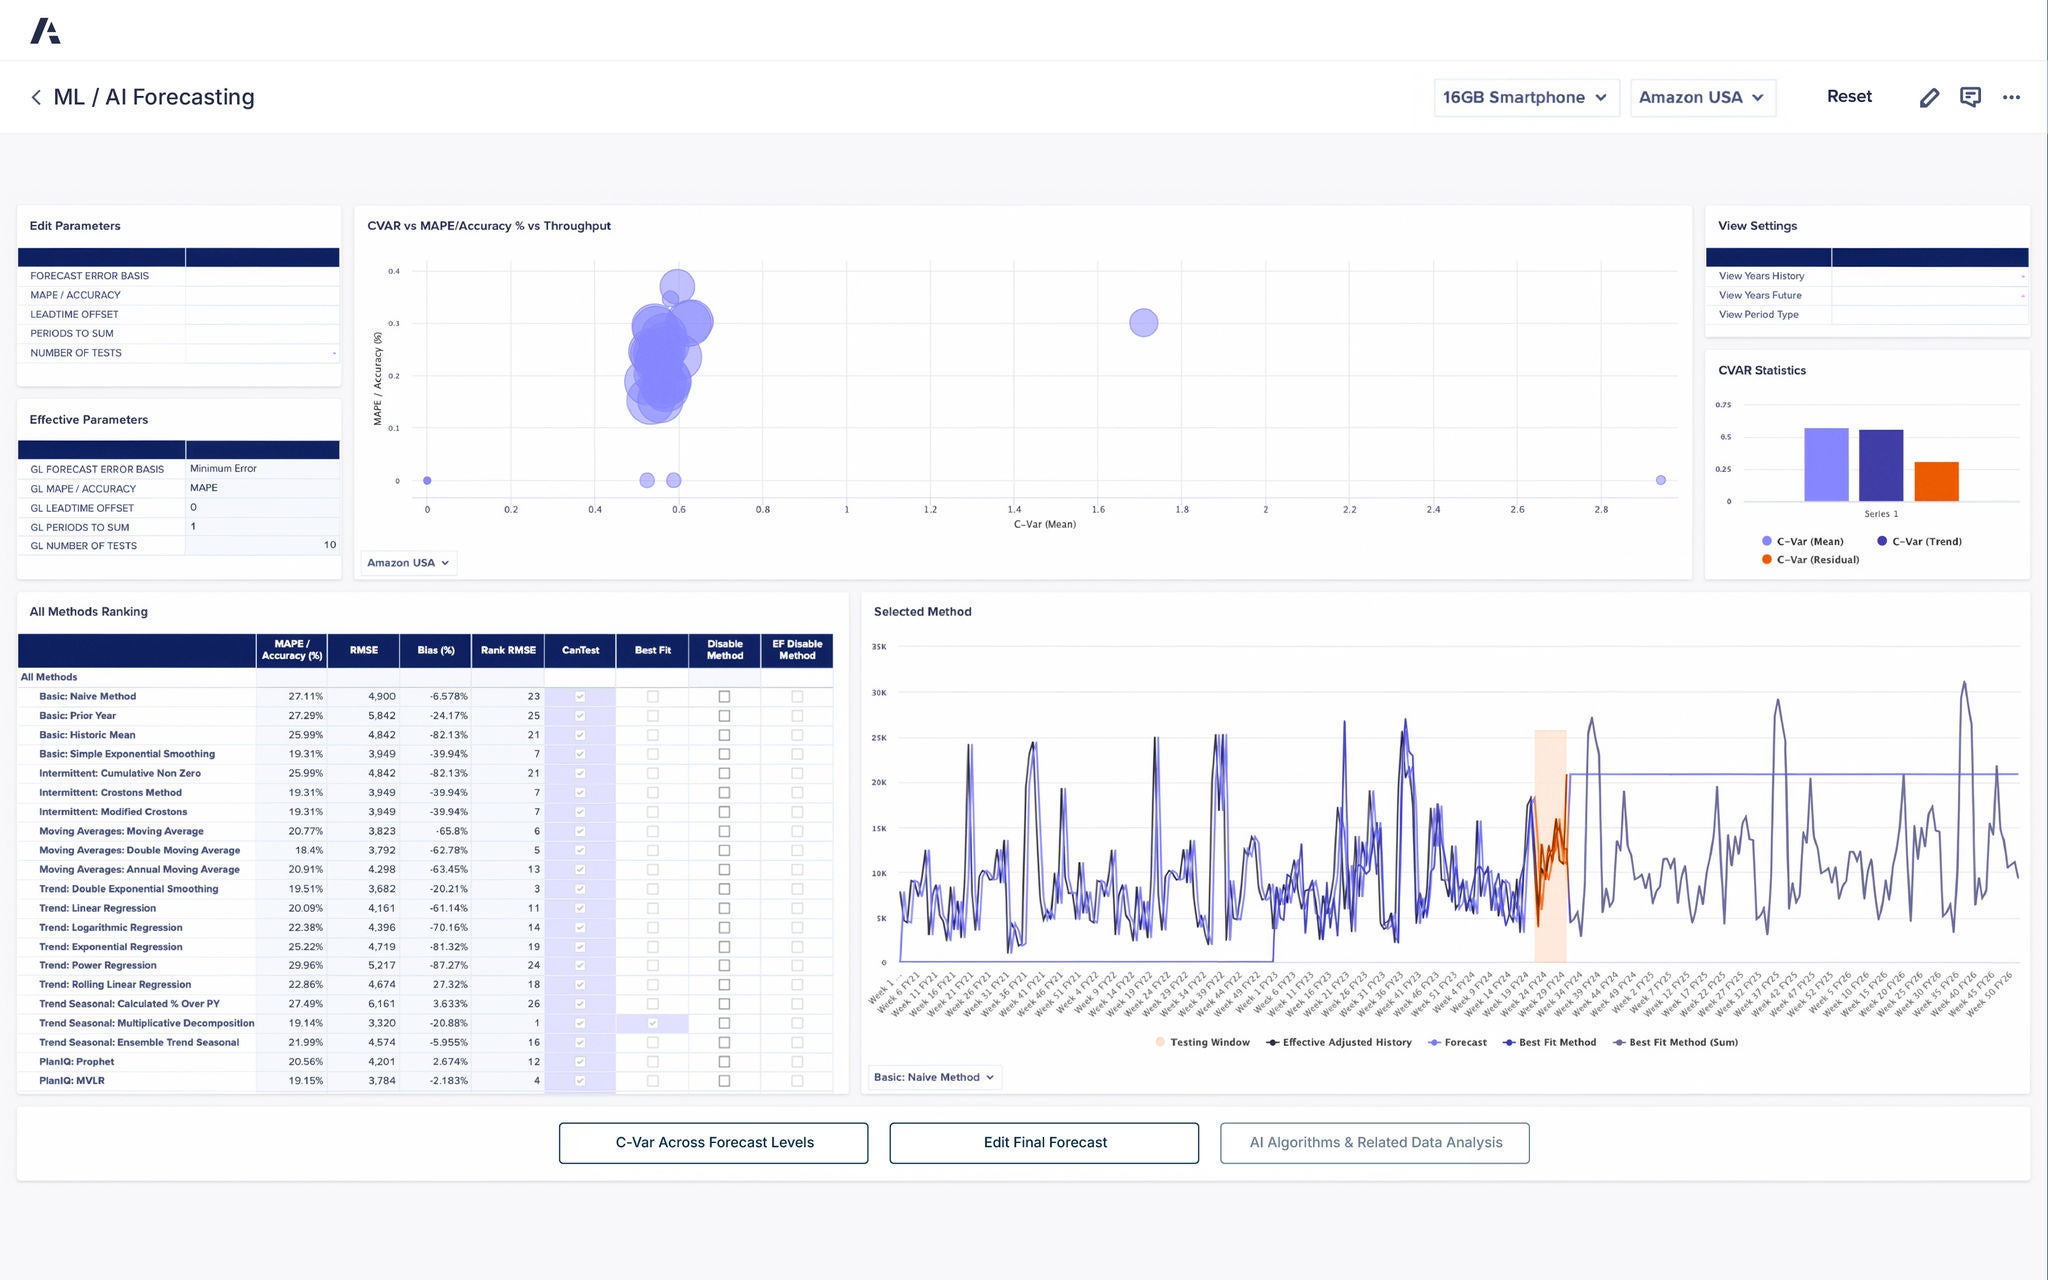
An Anaplan dashboard titled “ML / AI Forecasting,” displaying predictive analytics for product demand. The layout includes multiple panels and charts. On the left, an “Edit Parameters” section lists configurable options such as forecast error basis, MAPE/accuracy, lead/offset, periods to sum, and number of tests, alongside an “Effective Parameters” summary. The center scatter plot visualizes CVAR vs. MAPE/Accuracy vs. Throughput for forecast performance, represented by blue circular data points. To the right, “CVAR Statistics” are displayed as a bar chart comparing mean, trend, and residual values. The bottom section shows a detailed “All Methods Ranking” table listing forecasting algorithms including Naive, Moving Average, Exponential Smoothing, and Regression methods, with columns for MAPE/Accuracy, RMSE, Bias, and rank values. The adjacent line chart, titled “Selected Method,” plots historical and forecast data trends for “16GB Smartphone – Amazon USA,” showing peaks and testing periods in orange highlights. Buttons along the bottom include “C-Var Across Forecast Levels,” “Edit Final Forecast,” and “AI Algorithms & Related Data Analysis.”

Anaplan Statistical Forecasting アプリケーション

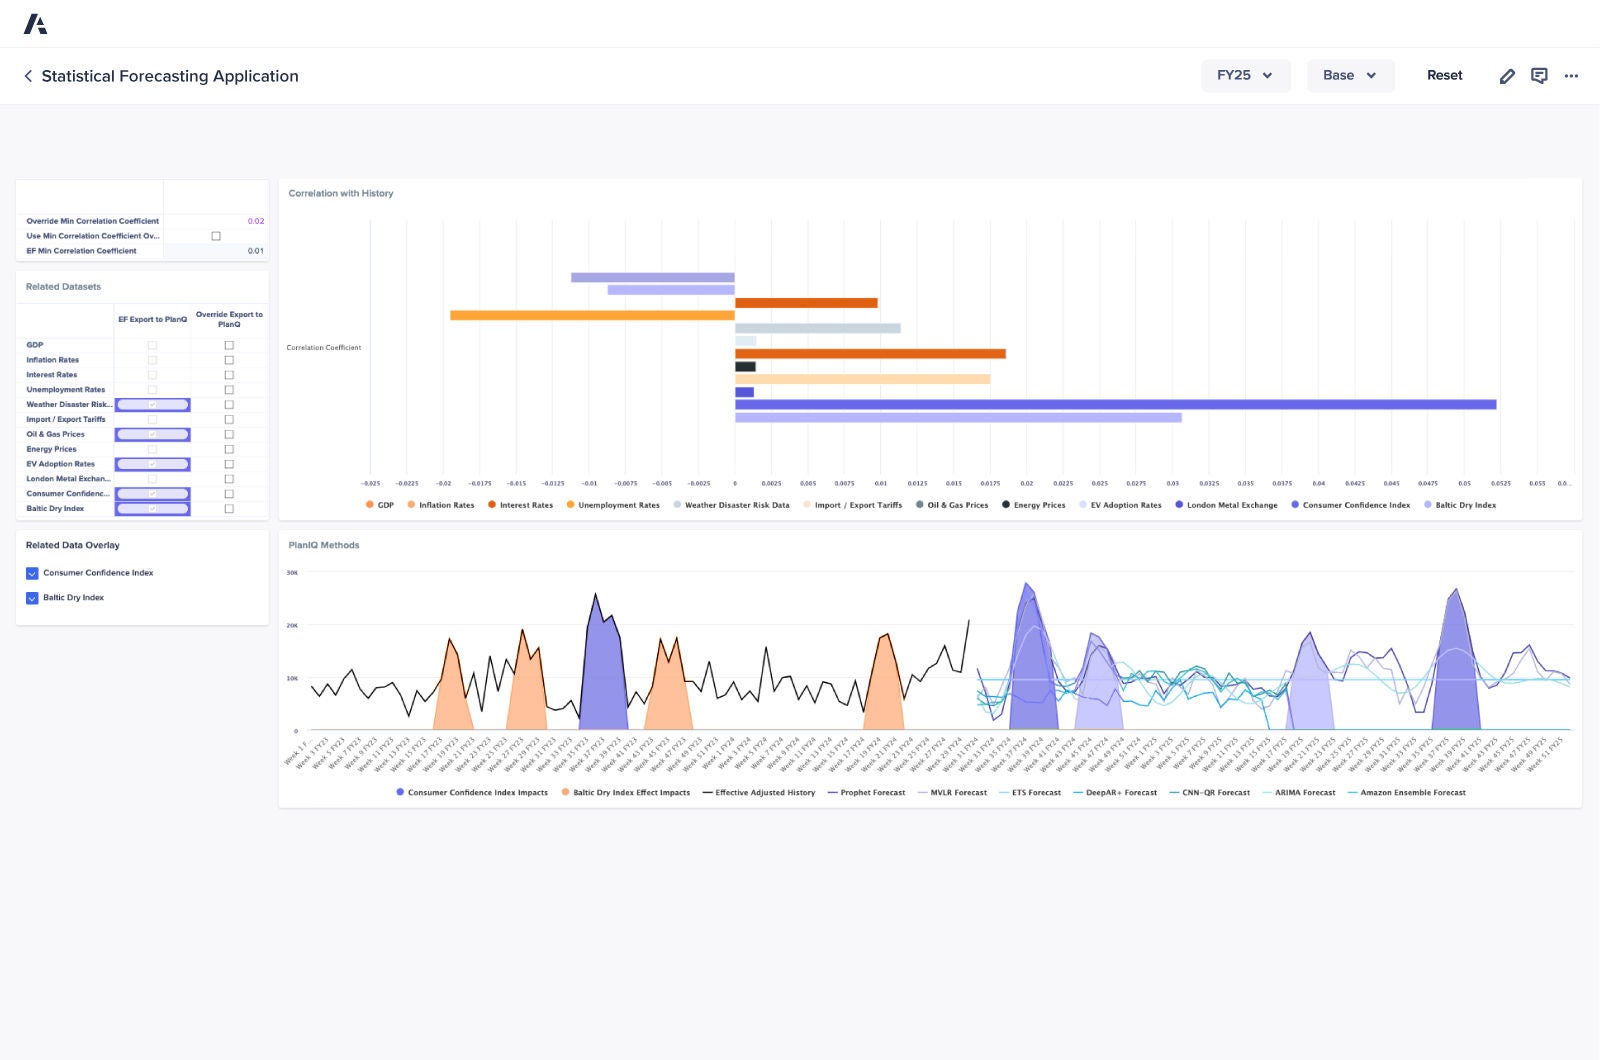
AI と ML を活用してデータ主導の統計フォーキャストを提供する専用のアプリケーションで、サプライチェーン全体を連携します。

Statistical Forecasting Application dashboard displaying correlation analysis with various economic indicators and a time series chart comparing forecasting methods, including Consumer Confidence Index and Baltic Dry Index impacts.
Soft Blue to Cream Gradient Background

「Anaplan は、はるかに使いやすい AI ソリューションを提供してくれました。特定の予測がなぜ生成されたのかについての説明性も高く、これは、当社にとって非常に重要なポイントです。すべての製品に対してプランニングを行うのではなく、例外ベースでプランニングを行うことを可能にします」


プラヴィーン・クスマ (Praveen Kusuma) 氏、E2E サプライチェーン オペレーション/デジタル化責任者、Straumann Group

Straumann Logo

サプライチェーン部門のリーダーが信頼するプラットフォームを実際にご覧ください。Be the next.

世界中のサプライチェーン チームが Anaplan でコネクテッド エンタープライズを構築しています。ぜひご検討ください。

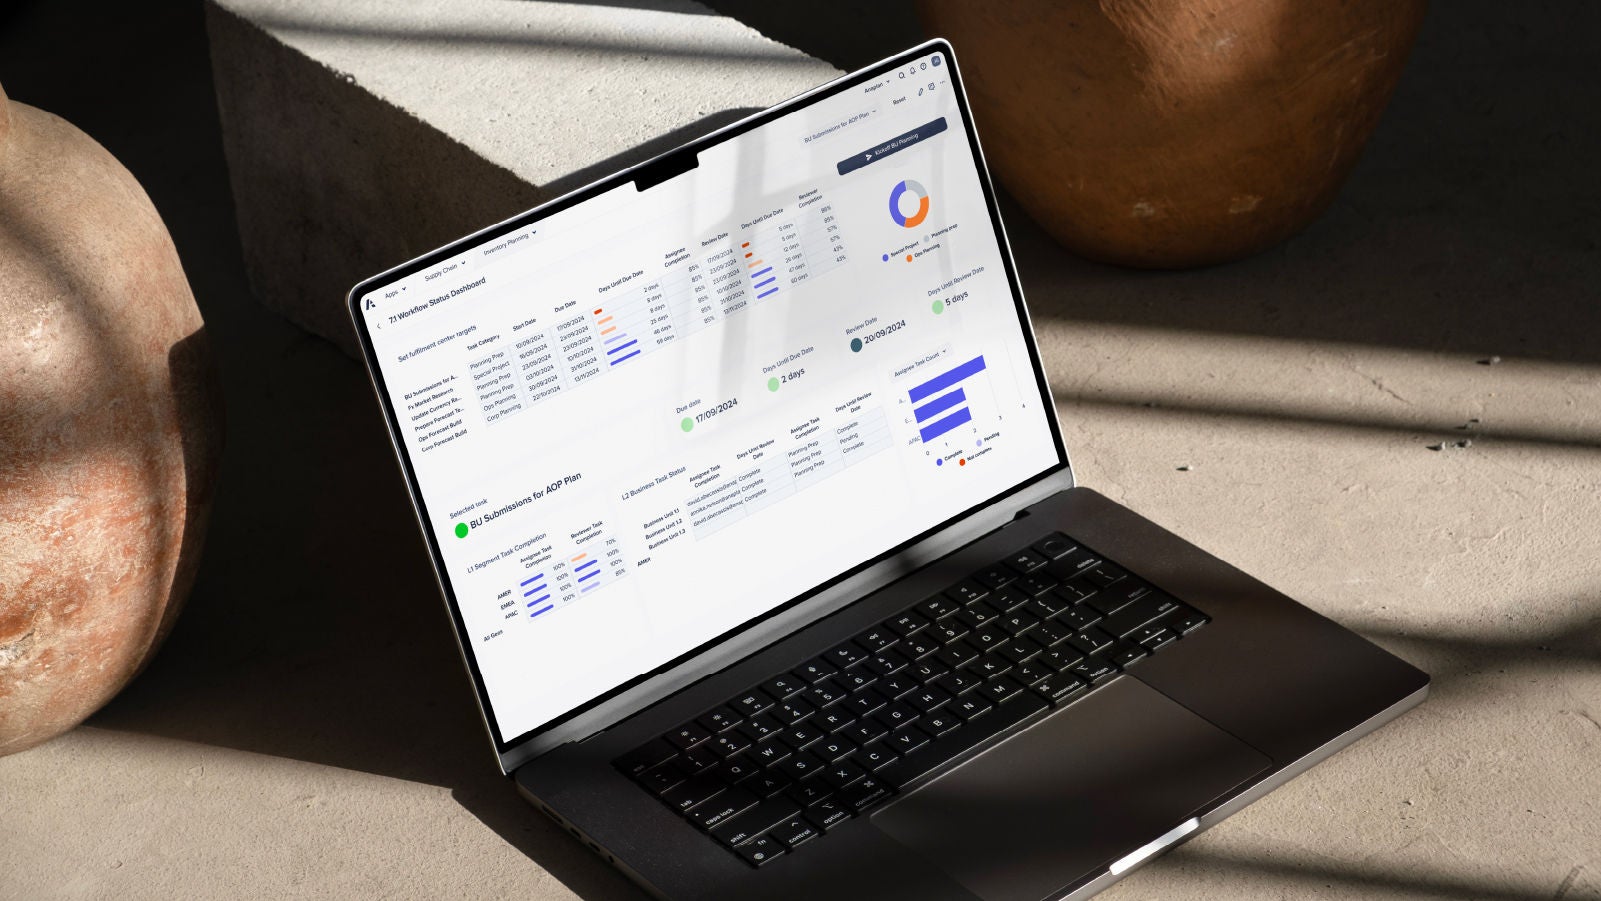
A laptop displaying a dashboard interface, positioned on a table, showcasing data and analytics.