ヘッドカウント プランニング

人件費を正確に予測し、人材計画を財務計画をシームレスに連動

人件費をリアルタイムでプランニングし、フォーキャスト、管理するための俊敏性と精度を提供し、ワークフォース戦略とファイナンス戦略を整合させます。

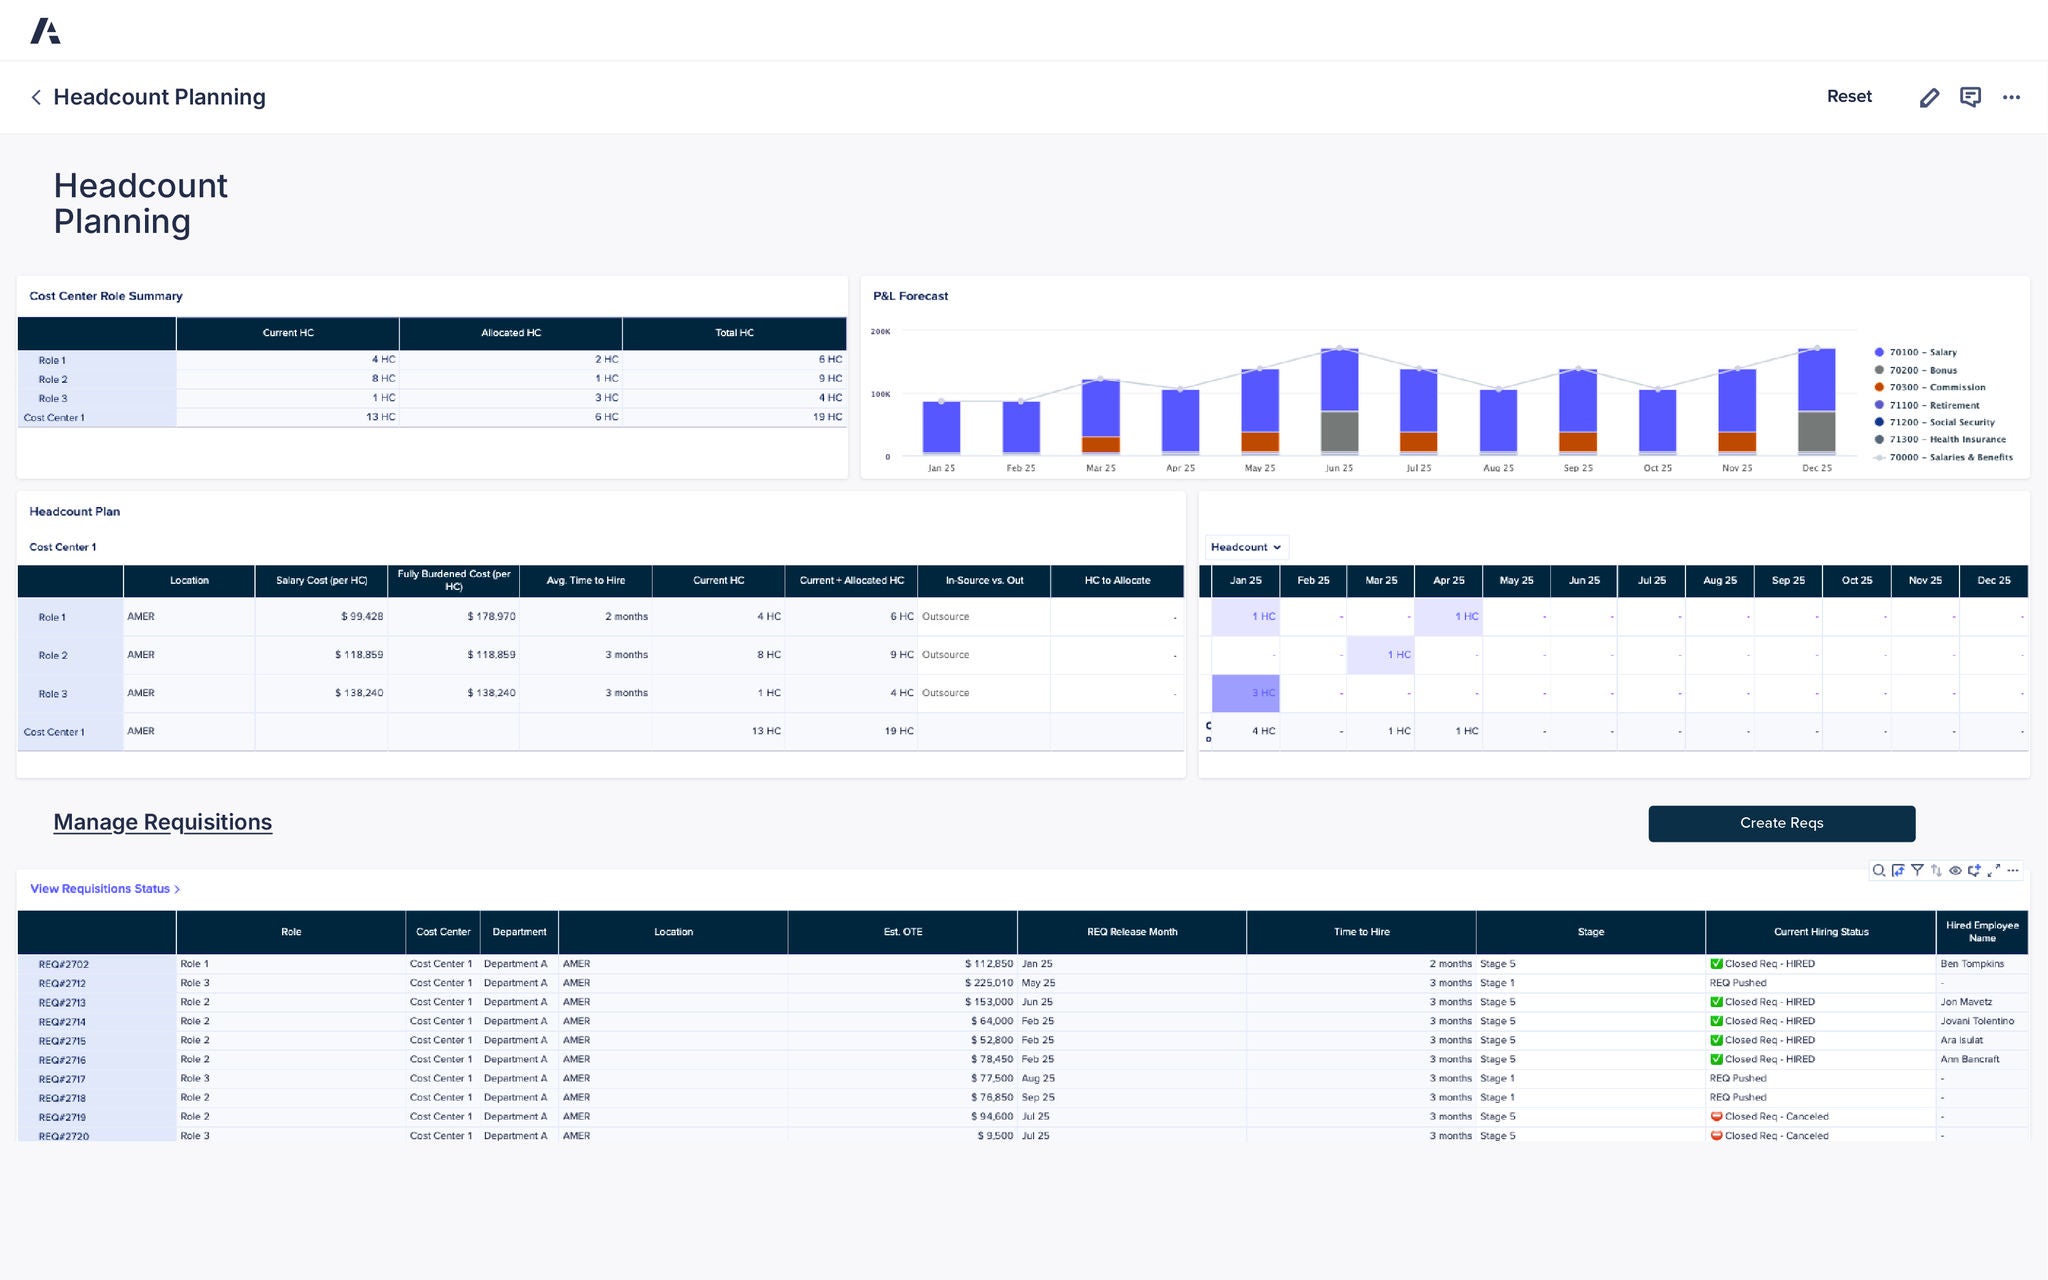
Dashboard titled Headcount Planning. Cost Center Role Summary table shows current, allocated, and total headcount across roles and cost center. P&L Forecast chart displays salary, bonus, commission, social security, health insurance, and benefits costs by month with stacked bars from Jan 25 to Dec 25. Headcount Plan table includes salary cost, fully burdened cost, average time to hire, current and allocated headcount, and in-source vs outsource breakdown. Calendar view shows monthly headcount allocations. Section Manage Requisitions lists requisition IDs, roles, cost centers, departments, locations, estimated OTE, release month, time to hire, stage, hiring status, and hired employee names.

2025 年「Gartner® Magic Quadrant™」ファイナンシャル プランニング (財務計画) ソフトウェア部門

Anaplan が 2025 年「Gartner® Magic Quadrant™」のファイナンシャル プランニング (財務計画) ソフトウェア部門において 9 年連続でリーダーに選出、実行能力とビジョンの完全性で高い評価を獲得しました。
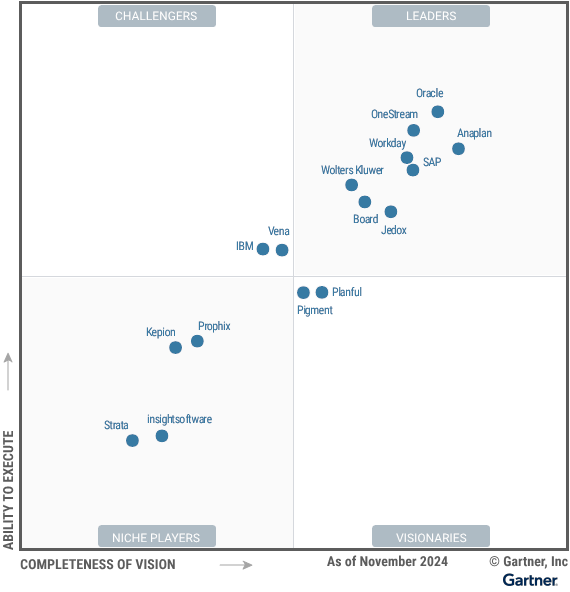

Gartner Magic Quadrant for Financial Planning Software as of November 2024. Anaplan, Oracle, SAP, and Workday appear in the Leaders quadrant.

人件費のプランニングとフォーキャストに明確性と自信をもたらす

リアルタイム データ、ドライバーベースのモデル、コネクテッド コラボレーションにより、人件費をビジネス目標と整合させます。


Soft Blue to Cream Gradient Background

「当社は Anaplan で、現在およびフォーキャスト期間における未充足ポジションや従業員 1 人あたりのコストを可視化しています。これには、将来採用予定の候補者として、採用管理システムに登録されている人材も含まれます」


ソリューション アーキテクト、Outreach.io

Ping Identity Logo Ink Fresenius Logo Equativ Dark Blue Logo Sizewell C Logo Ink Momentive Dark Blue Logo Everest Logo

ファイナンス リーダーが信頼するプラットフォームを実際にご体験ください。
Be the next. 

世界中のファイナンス チームが Anaplan で競争を勝ち抜いています。ぜひご検討ください。

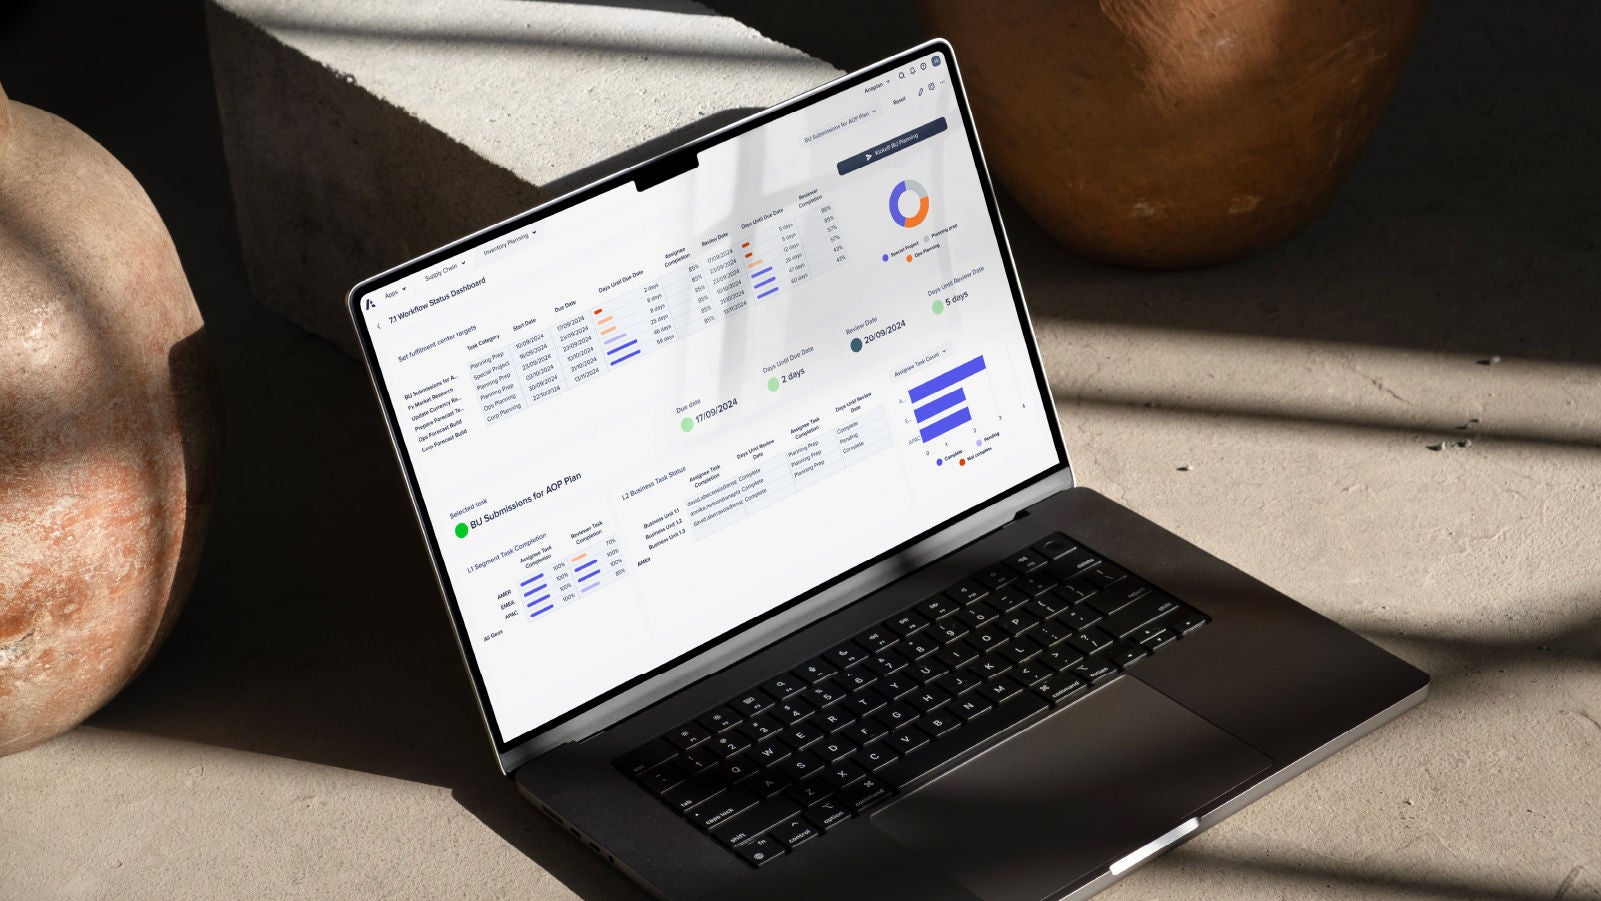
A laptop displaying a dashboard interface, positioned on a table, showcasing data and analytics.