サプライヤー コラボレーション

サプライヤー コラボレーションのためのインテリジェント ソリューション

ソーシングと調達のワーク ストリーム全体にわたってレジリエンスを高め、意思決定と価値創出を最適化します。
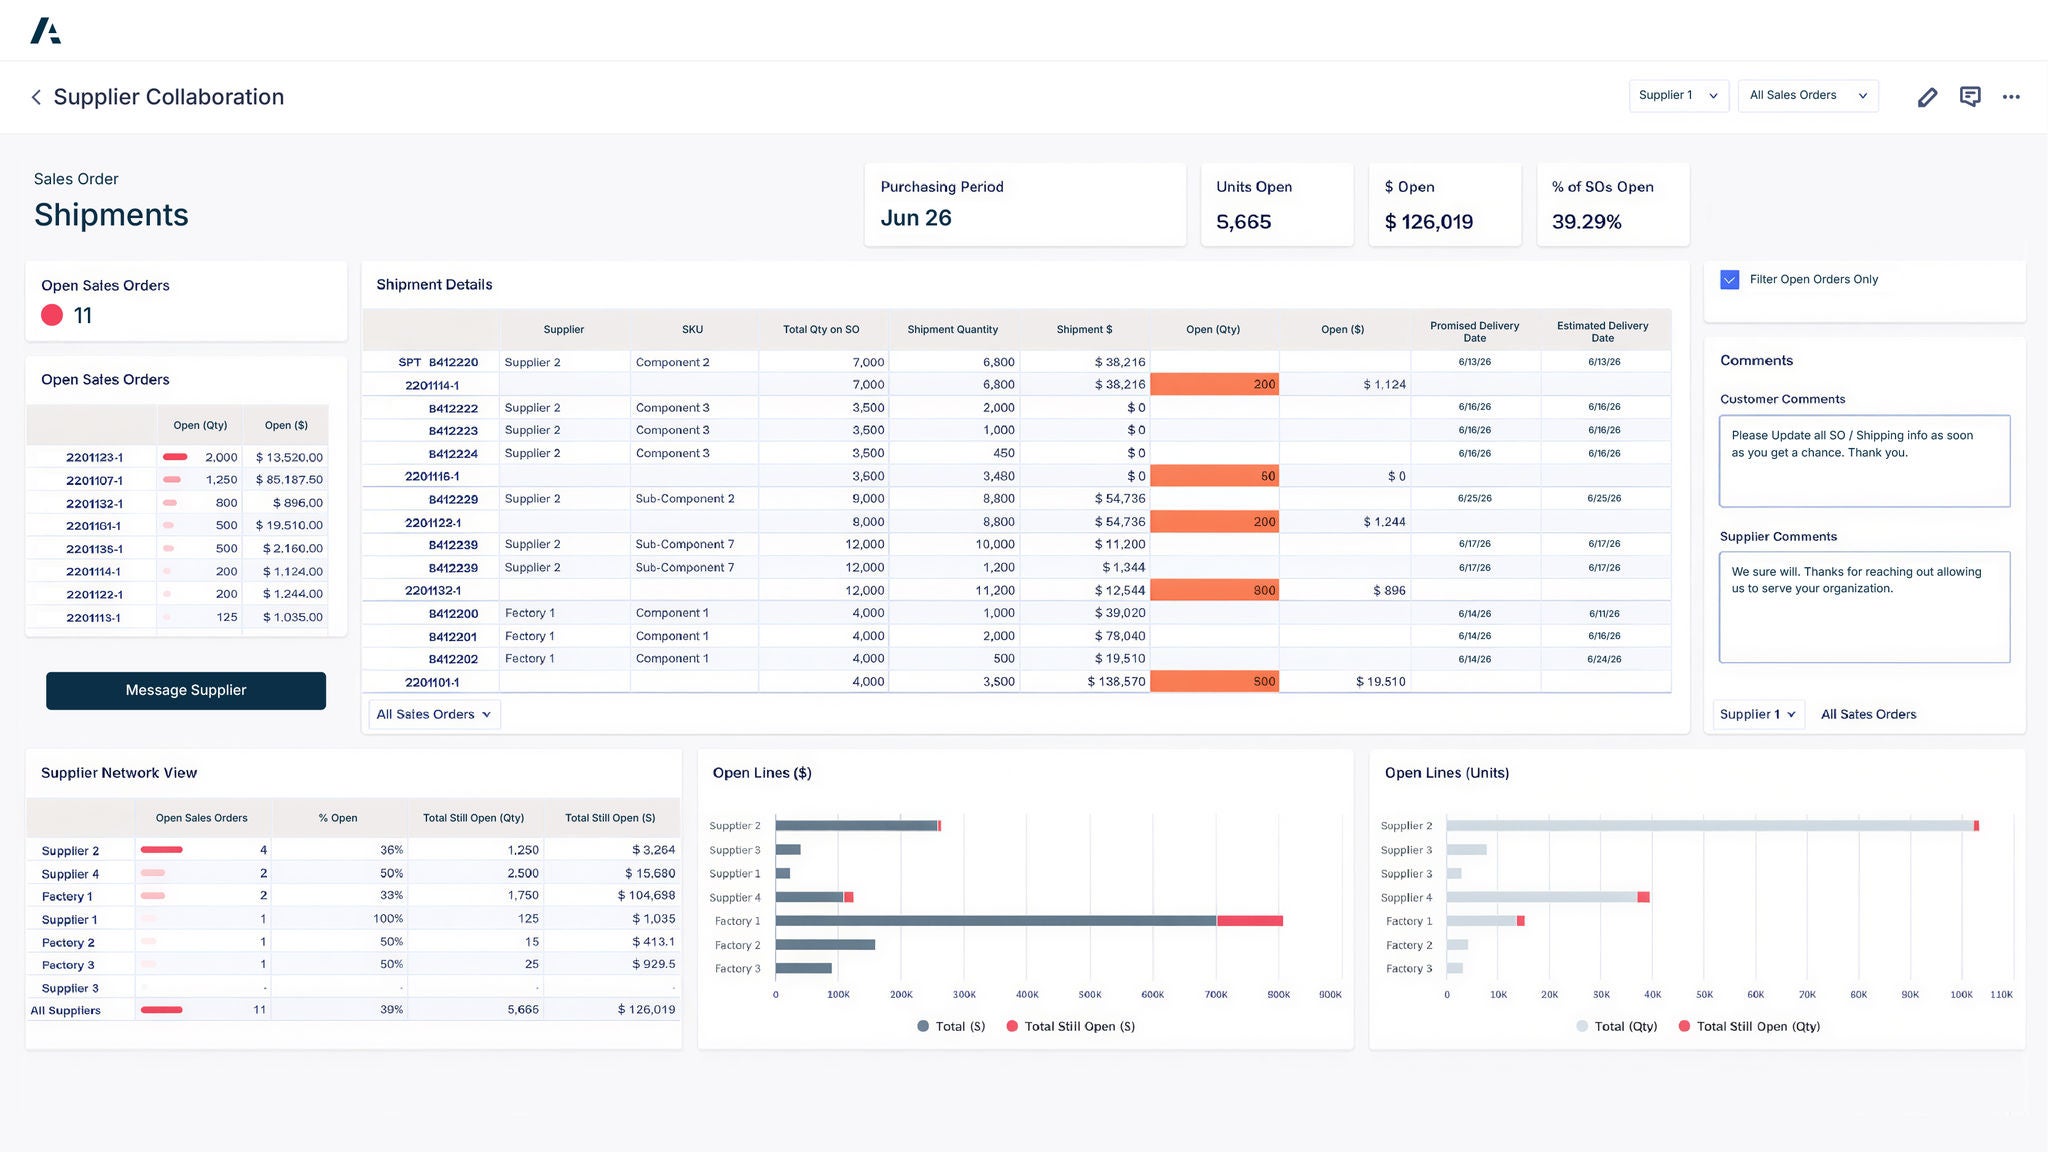
Dashboard interface showing supplier collaboration shipments with sales order details, shipment quantities, open orders, supplier network view, and charts displaying open lines in dollars and units.

すぐに導入可能な Anaplan の Spend Analysis and Forecasting アプリケーションの紹介

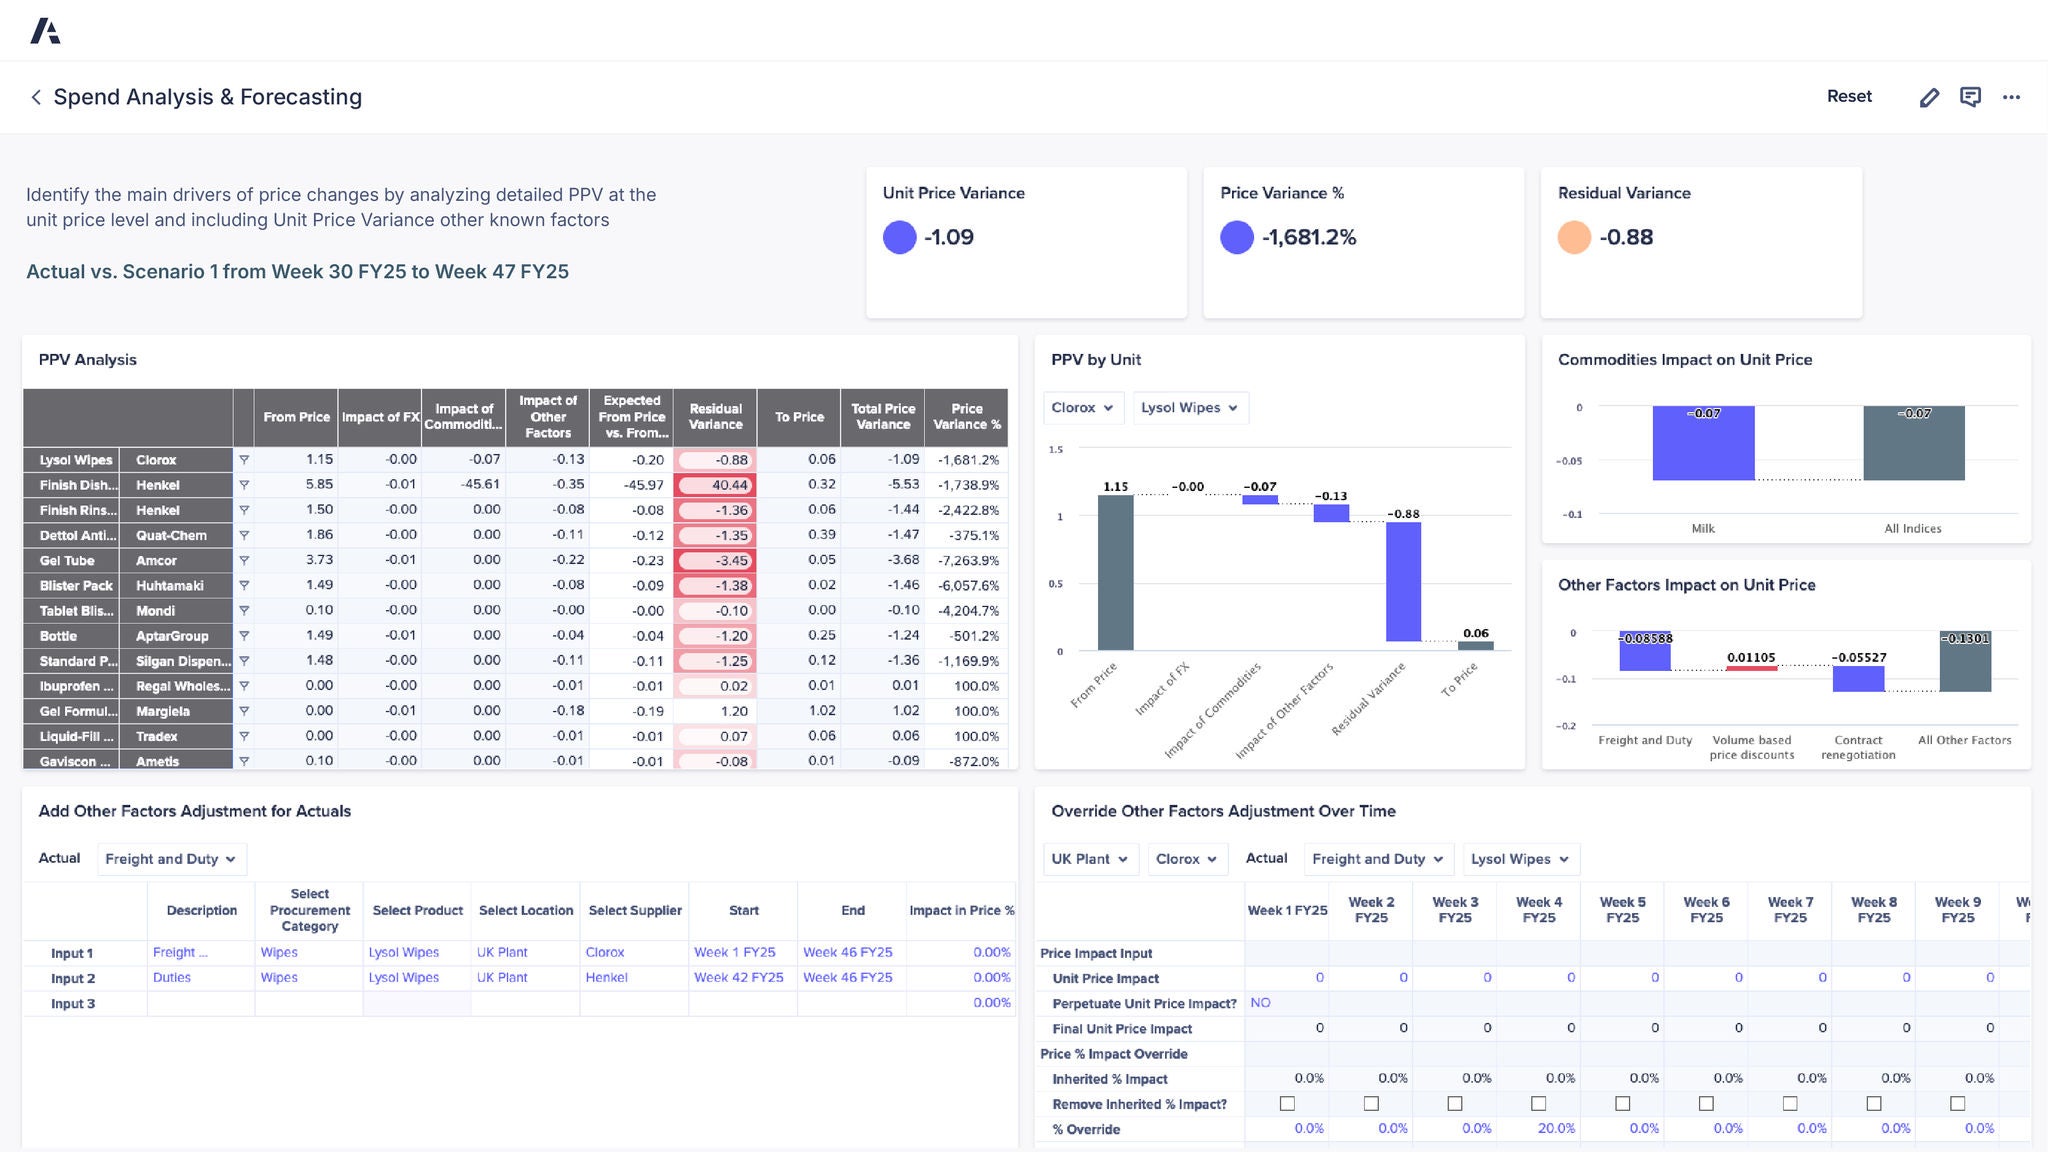
Anaplan Spend Analysis and Forecasting アプリケーションは、差異分析を自動化し、高精度な直接材支出のフォーキャストを実現できる、すぐに使える、AI ドリブン型の機能を提供します。

Spend Analysis & Forecasting dashboard comparing Actual vs. Scenario 1 from Week 30 FY25 to Week 47 FY25, showing unit price variance -1.09, price variance -1,681.2%, and residual variance -0.88, with a PPV analysis table, a PPV by unit waterfall for Clorox and Lysol Wipes, commodity and other factor impact charts, and tables for other factors adjustments and overrides over time.
Soft Blue to Cream Gradient Background

「Anaplan があれば、スタッフはデータ分析や包括的な計画の策定、将来のシナリオのモデリングに、より多くの時間をかけられるようになり… その結果、ファイナンス、セールス、サプライチェーンのチーム全体で、より優れた意思決定を実現できるようになります」


イザベル・ベレソール (Isabelle Bellessort) 氏、サプライチェーン部門グローバル ヘッド、Etex 社

Etex Logo Ink

サプライチェーン部門のリーダーが信頼するプラットフォームをご体験ください。
Be the next.

世界中のサプライチェーン チームが Anaplan で、現代にふさわしいコネクテッド エンタープライズを実現しています。ぜひご検討ください。

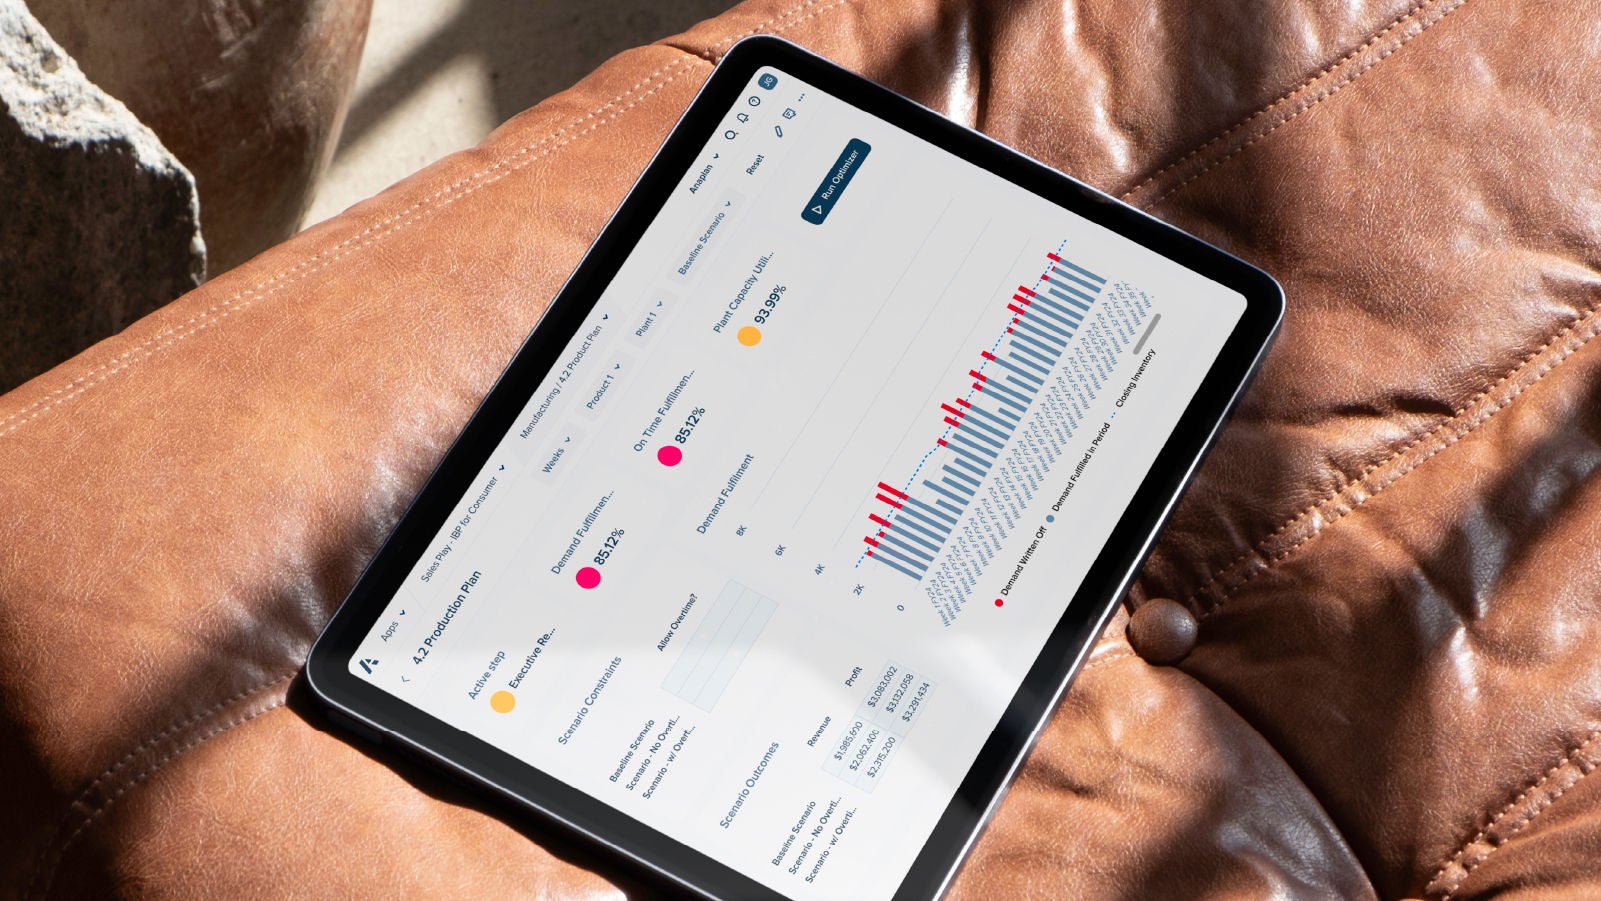
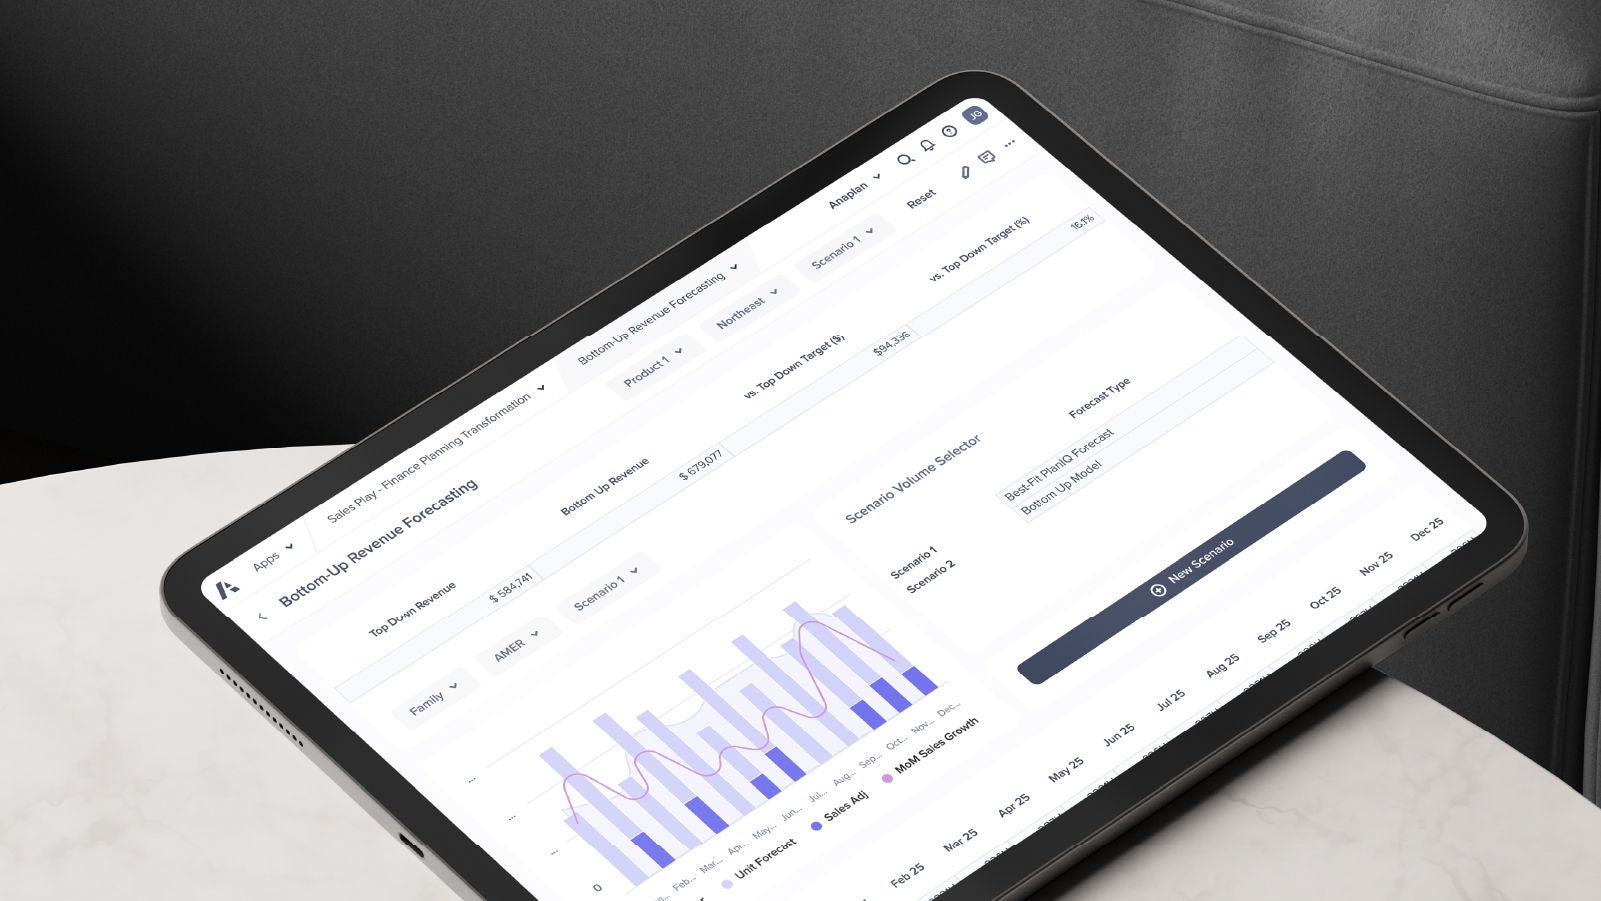
A tablet displaying the Anaplan Bottom-Up Revenue Forecasting interface. The screen shows scenario selection, forecast types, and a combined bar and line chart for monthly sales growth.