戦略的ワークフォース プランニング

戦略的ワークフォース プランニングのためのインテリジェント ソリューション

長期的な戦略と施策を成功裏に実行できるよう、ワークフォースの需要と供給のバランスを調整します。

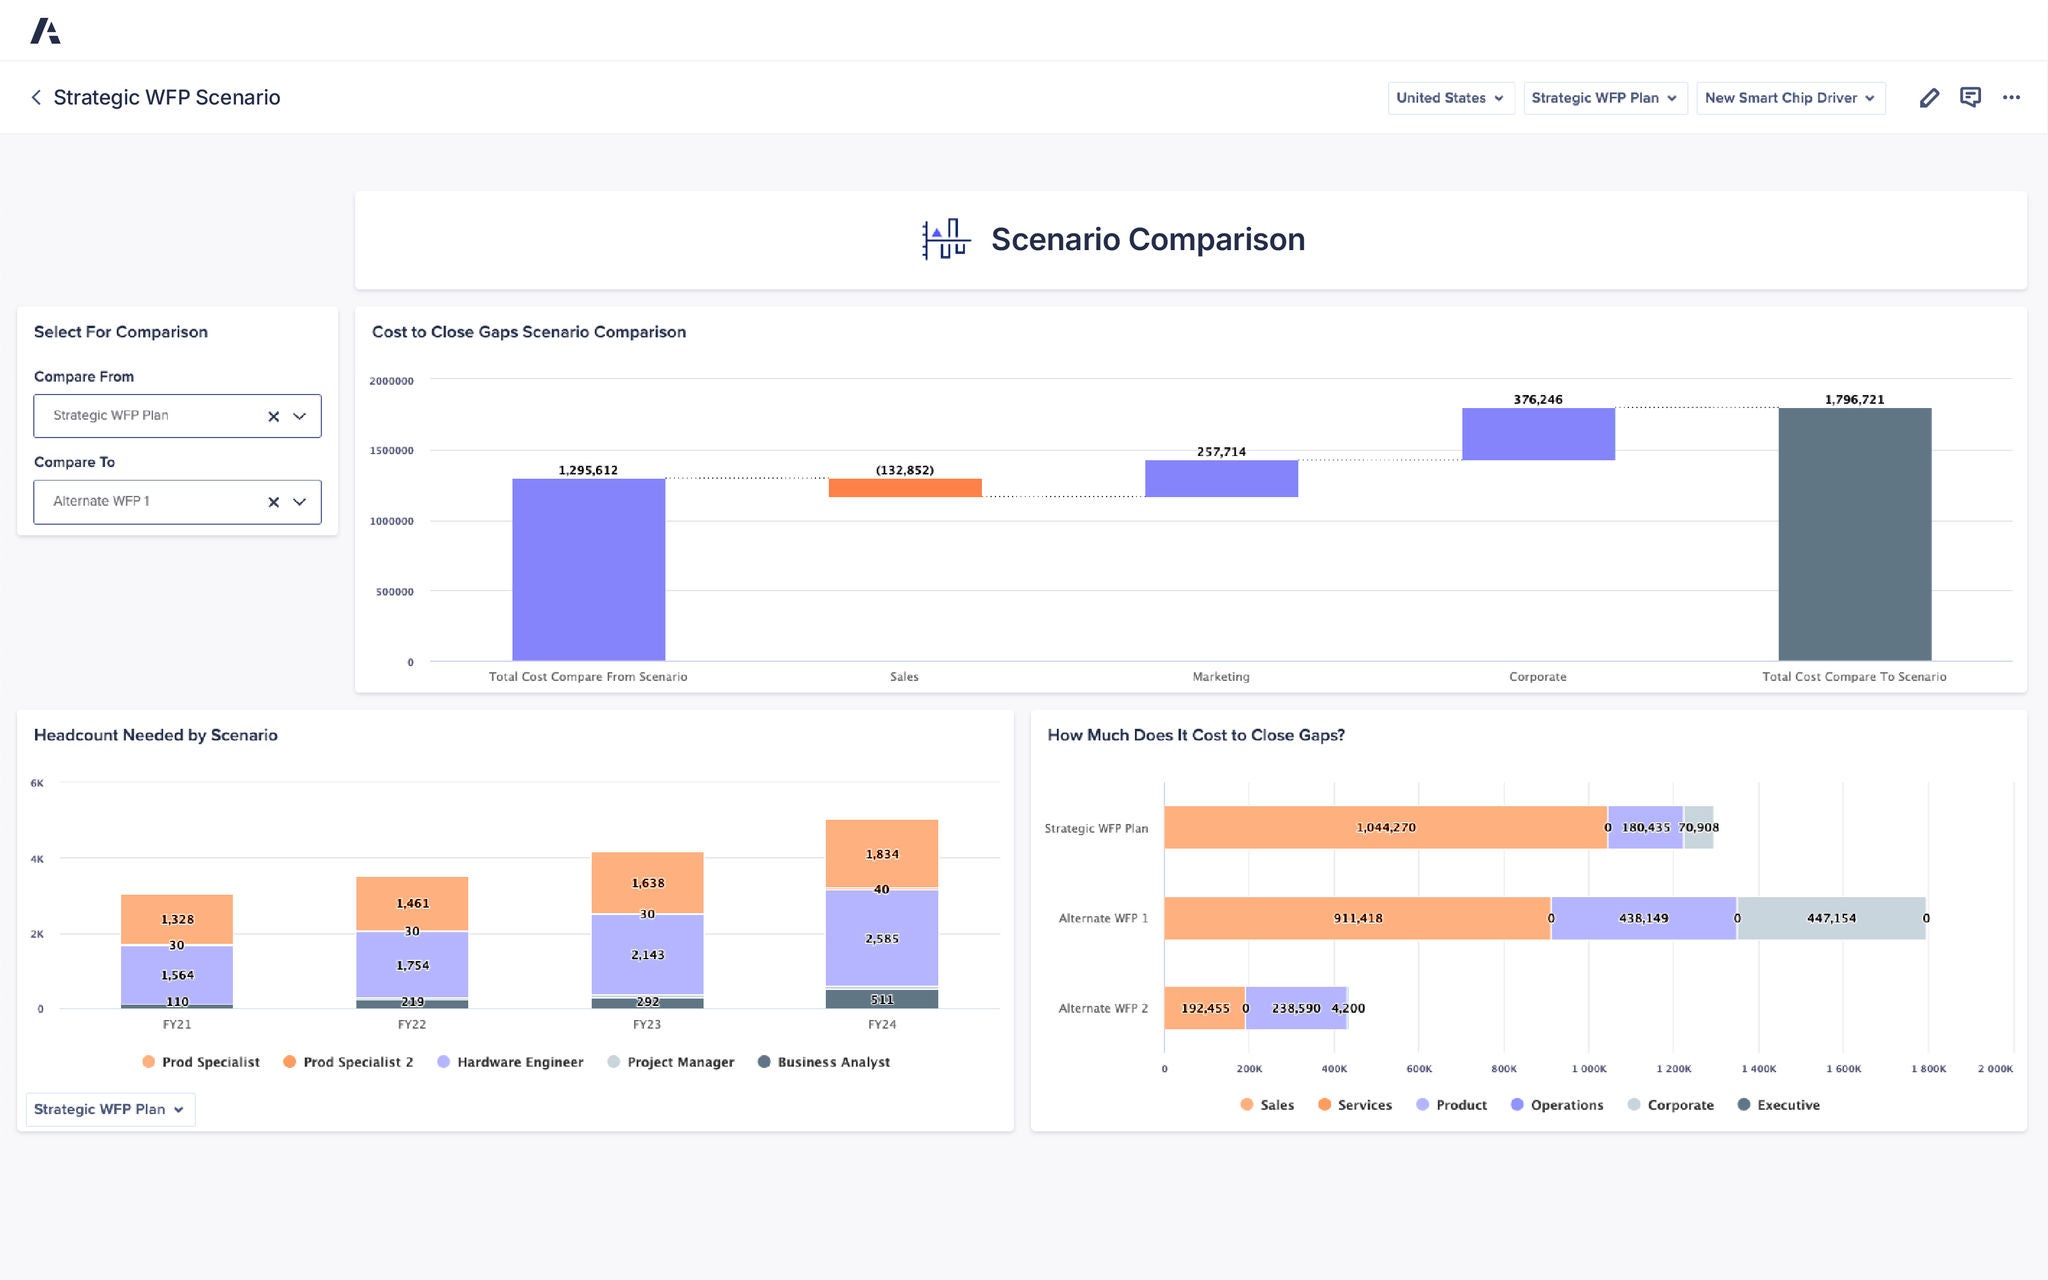
Dashboard titled Strategic WFP Scenario displaying a Scenario Comparison. Top bar chart compares costs across scenarios, with breakdowns for sales, marketing, and corporate, showing totals for "Compare From" and "Compare To" scenarios. Left panel allows selection of scenarios for comparison. Bottom left stacked bar chart shows Headcount Needed by Scenario for roles such as Product Specialist, Hardware Engineer, Project Manager, and Business Analyst across FY21–FY24. Bottom right horizontal bar chart illustrates Cost to Close Gaps by function (sales, services, product, operations, corporate, executive) for Strategic WFP Plan and alternate scenarios.

将来のビジネスニーズに対応する人材戦略を設計

ワークフォース プランニングを、長期にわたる俊敏性、生産性、人材の成果を促進するダイナミックかつ戦略的な能力へと変革します。


人事およびワークフォース プランニング リーダーのための独自の見解

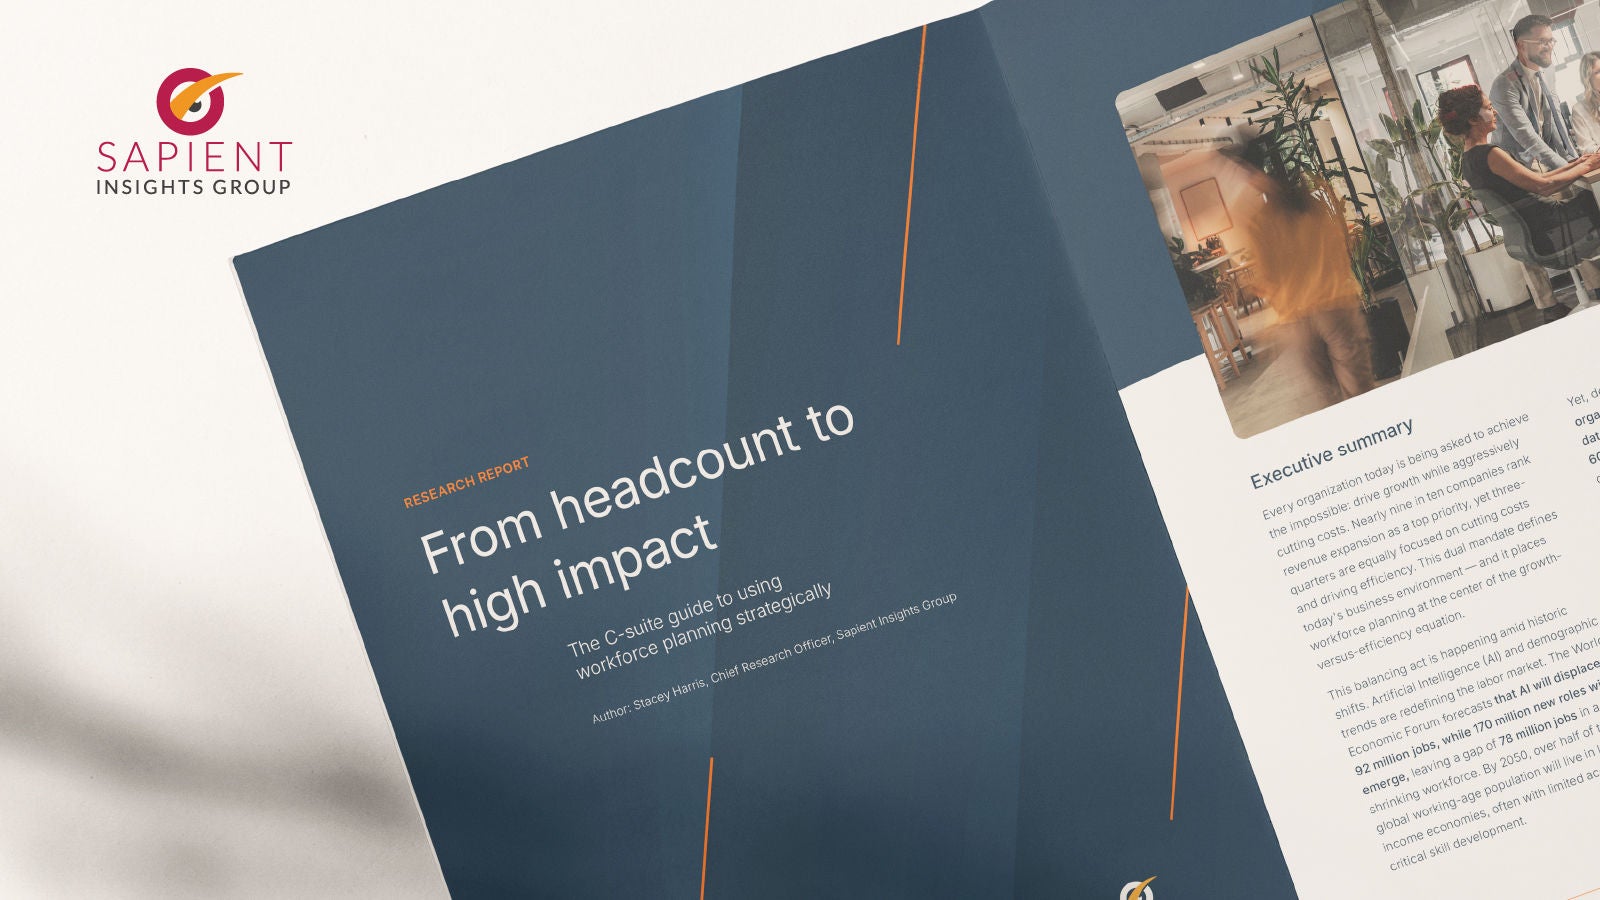
独立したエキスパートによるレポートと詳細な分析を活用し、マーケット トレンドを先取りしましょう。

Anaplan "A" logo in a stylized outline design, featuring three distinct orange gradient shapes on the background.

ビジネス戦略、ニーズ、市場トレンドに基づいて将来のワークフォースを計画

人材ギャップやコストを予測し、リアルタイムのインサイトを基にアクションを起こし、すべての長期的なワークフォースに関する意思決定をビジネス目標と整合させます。


Soft Blue to Cream Gradient Background

「多くの場合、人は従来のやり方を基に未来の解釈や予測をするものですが、現在のやり方が、明日や 5 年後、10 年後にも通用するとは限りません」


人材プランニング/インクルージョン担当マネージャー、鉄道インフラ企業

ワークフォース プランニング リーダーが信頼するプラットフォームを実際にご体験ください。
Be the next.

世界中の組織が Anaplan でコネクテッド エンタープライズを構築しています。ぜひご検討ください。

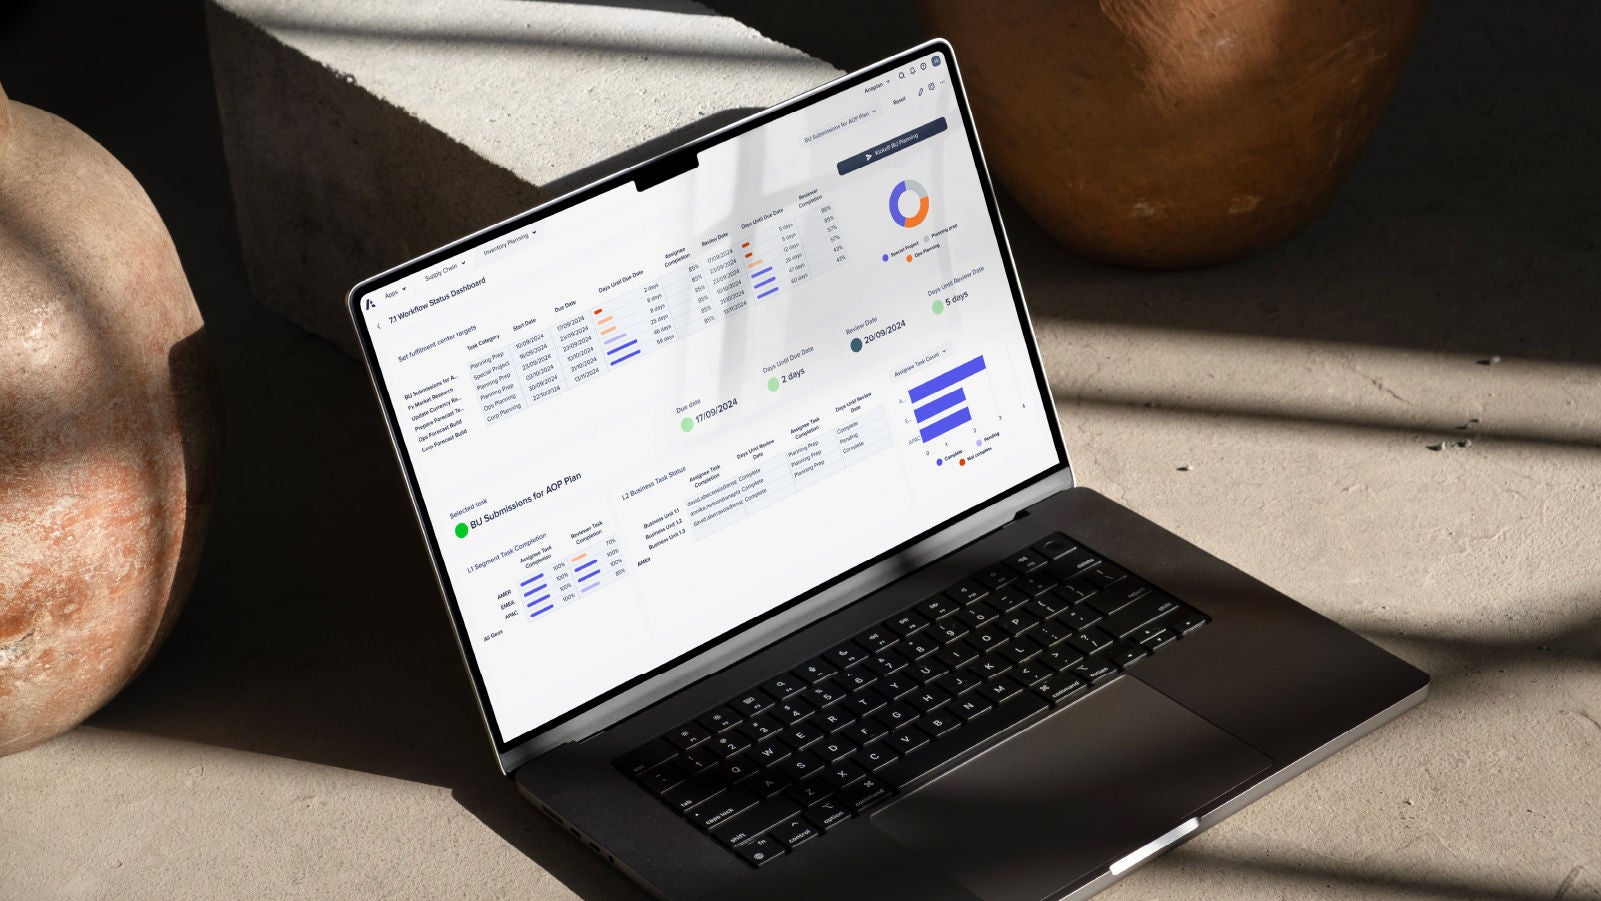
A laptop displaying a dashboard interface, positioned on a table, showcasing data and analytics.