セールス インセンティブ

セールス インセンティブのためのインテリジェント ソリューション

数百のプラン、数千人の対象者、数百万件の取引に対応し、 インセンティブの設計・整合・拡張を実現。
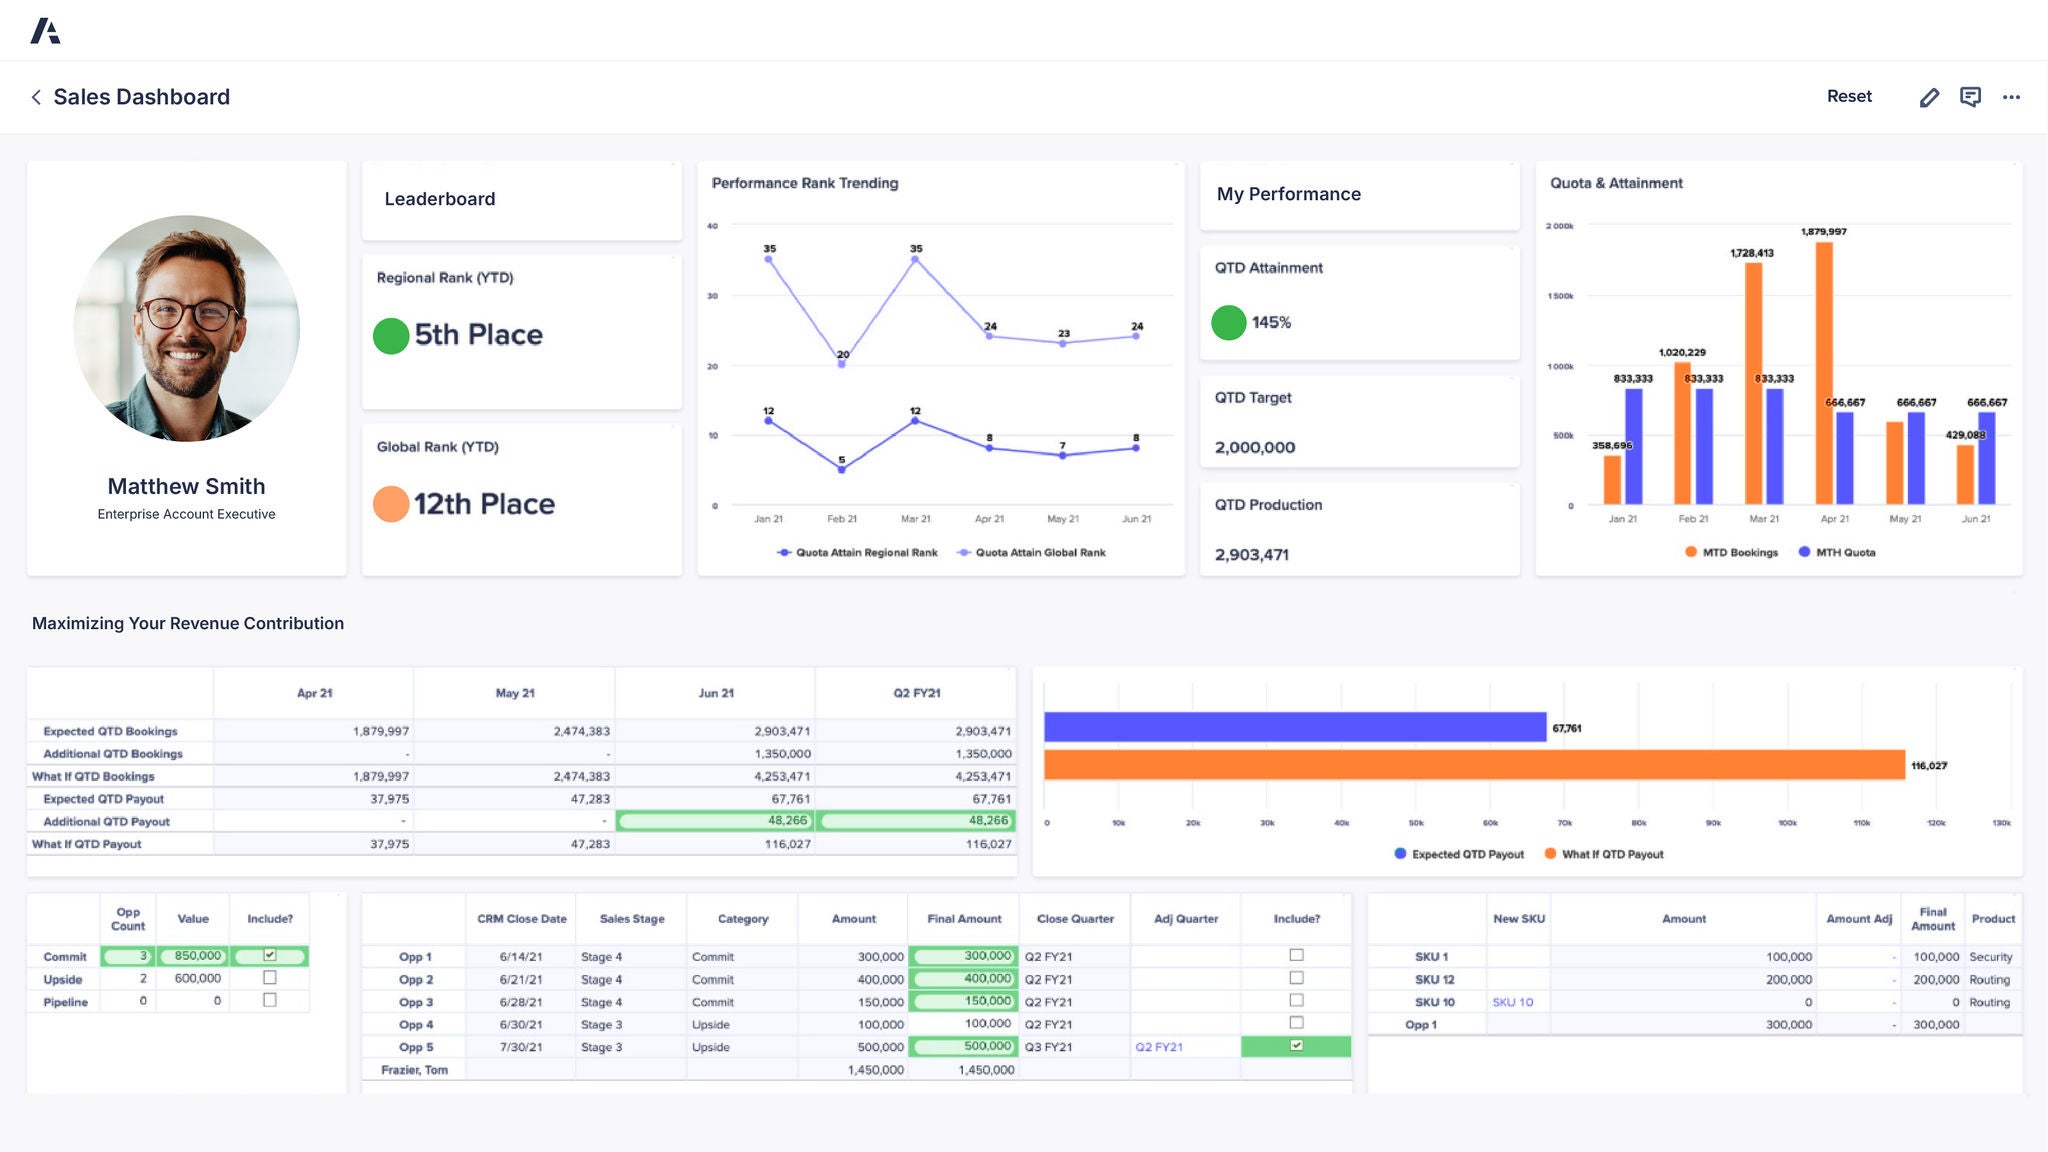
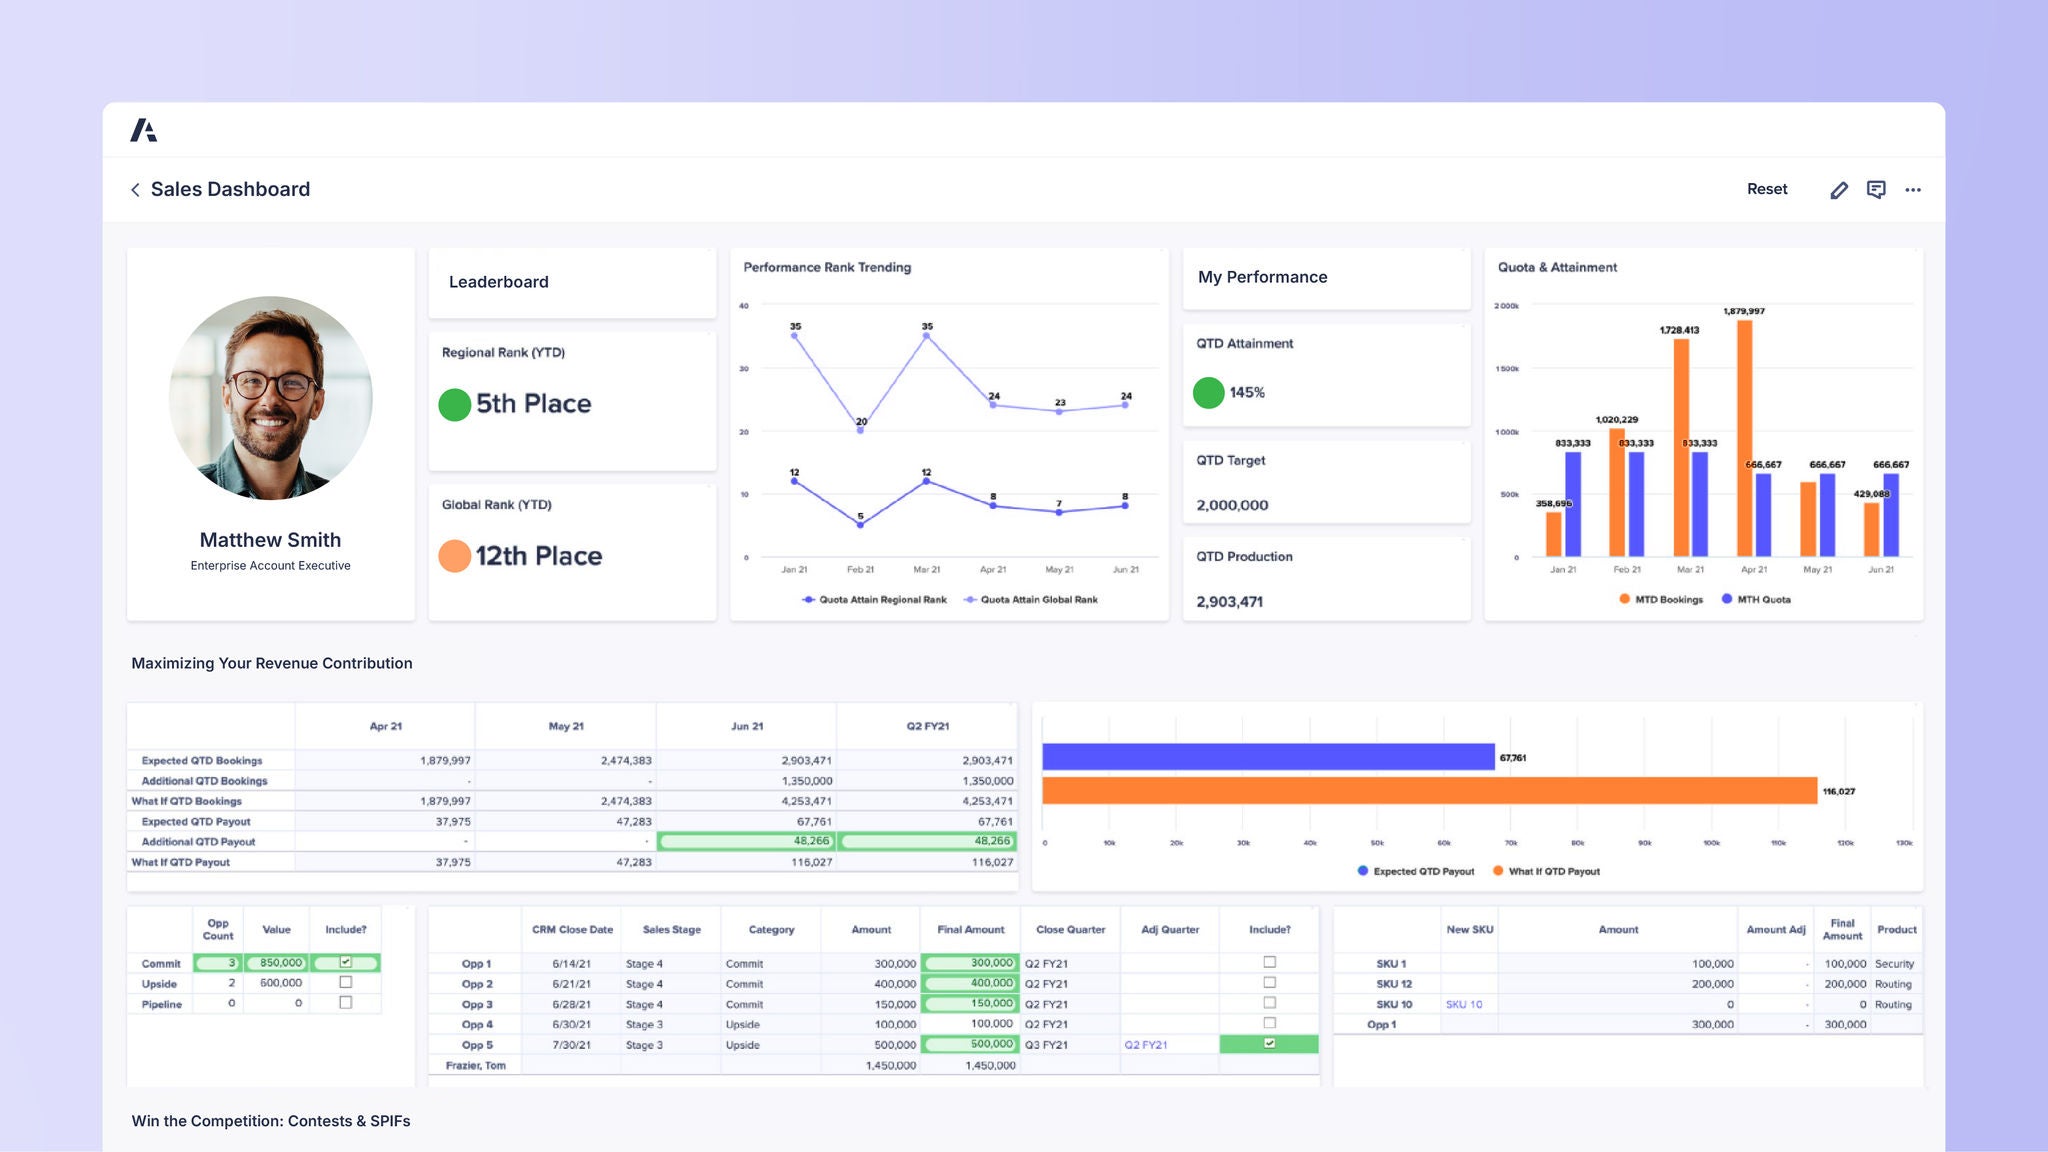
Dashboard titled Sales Dashboard. Top left shows profile photo of Matthew Smith, Enterprise Account Executive, with leaderboard ranking: Regional Rank (YTD) 5th Place and Global Rank (YTD) 12th Place. Performance Rank Trending chart shows fluctuating line graph of regional vs global rank from Jan to May. My Performance panel shows QTD Attainment 145%, QTD Target 2,000,000, and QTD Production 2,903,471. Quota & Attainment bar chart compares MTD Bookings and MTH Quota across Jan–Jun, with highest bookings in Apr 21 at 1,879,997. Middle section “Maximizing Your Revenue Contribution” displays expected and additional QTD bookings and payout values for Apr–Jun and Q2 FY21. A bar graph shows Expected QTD Payout vs What If QTD Payout. Bottom tables show opportunities by commit, upside, and pipeline, detailed opportunity entries with CRM close dates and amounts, and SKU listings with adjustments and product categories.

セールス部門のリーダーが信頼するプラットフォームを実際にご体験ください。
Be the next.

世界中の収益管理および営業オペレーションチームが Anaplan で競争をリードしています。ぜひご検討ください。

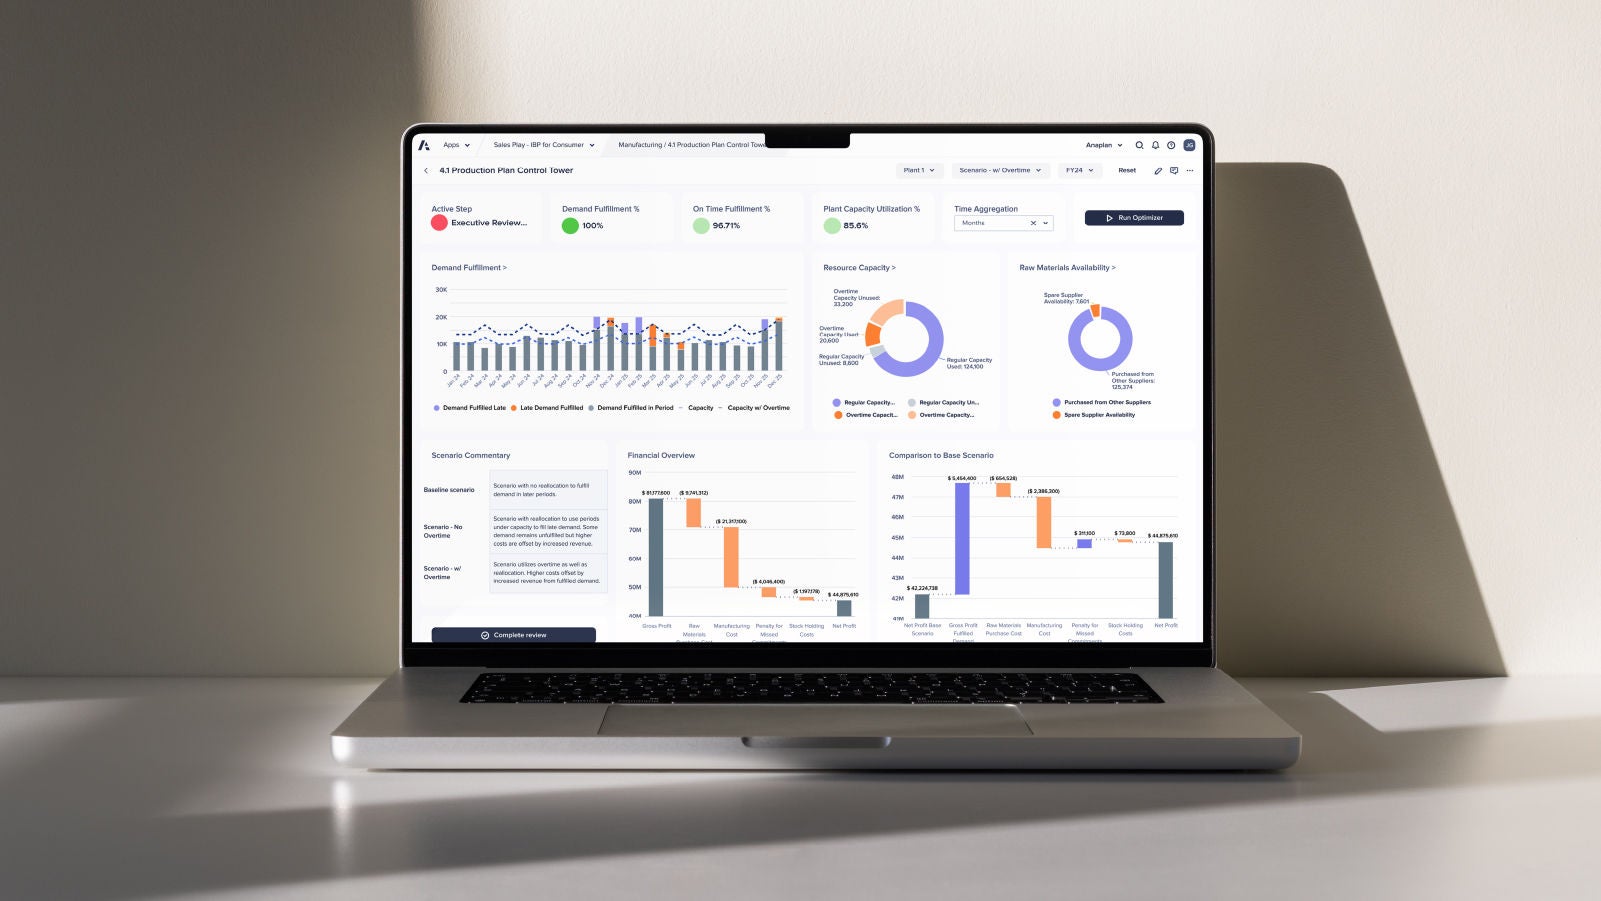
A laptop screen showcasing a dashboard filled with various graphs and data visualizations.