統合財務諸表

財務諸表を連携してインサイト獲得のスピードを向上

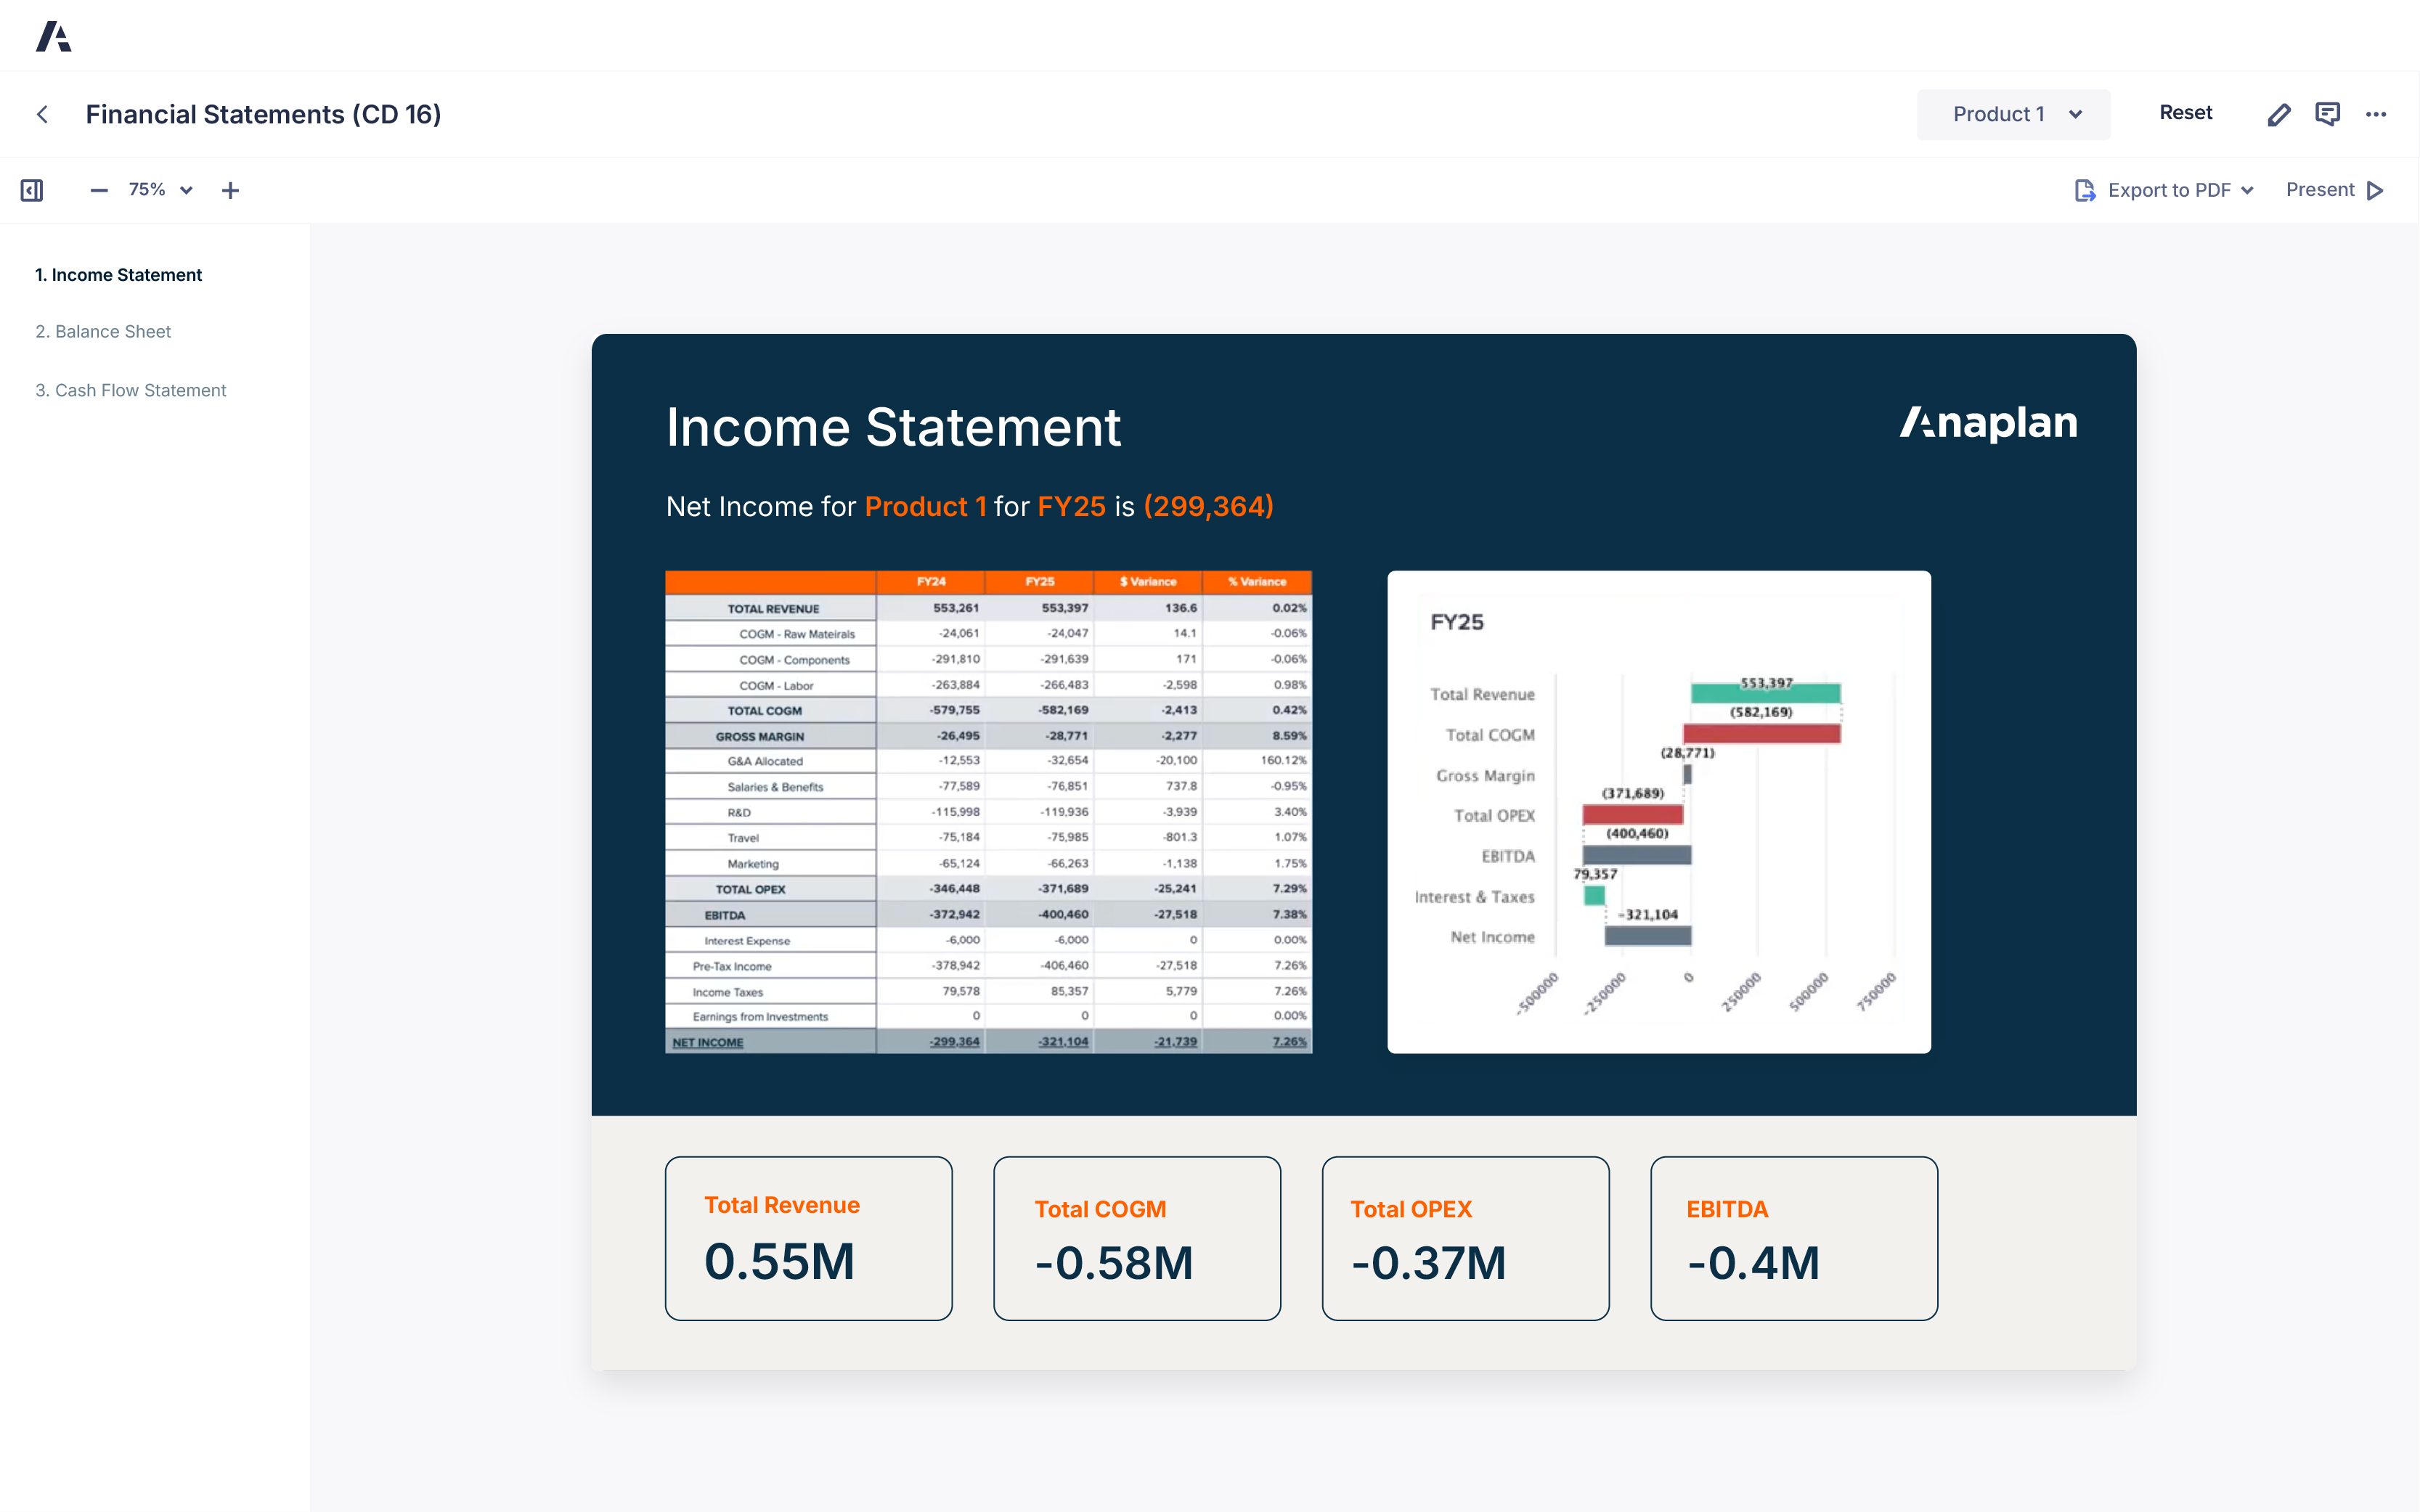
損益計算書、貸借対照表、キャッシュフロー計算書を連携させた単一の動的なモデルをファイナンス部門に提供し、ビジネスのファイナンスの健全性を包括的かつ統合的に把握できるようにします。

Dashboard titled Financial Statements (CD 16) displaying an Income Statement for Product 1 in FY25. Left sidebar lists tabs: Income Statement, Balance Sheet, and Cash Flow Statement. Main panel shows a table comparing FY24 vs. FY25 revenue, COGM (raw materials, components, labor), OPEX (G&A, salaries, R&D, travel, marketing), EBITDA, interest, taxes, and net income. A bar chart visualizes FY25 totals for revenue, COGM, gross margin, OPEX, EBITDA, and net income. Summary metrics at the bottom highlight Total Revenue 0.55M, Total COGM -0.58M, Total OPEX -0.37M, and EBITDA -0.4M.

Anaplan Integrated Financial Planning アプリケーション

Anaplan Integrated Financial Planning アプリケーションは、ファイナンシャル プランニングと分析のあらゆる要件に対応できる、導入後すぐに使用できるローコードの業務特化型アプリケーションです。

Integrated Financial Planning Dashboard

「Anaplanを使えば、経営陣が必要とする可視性のあるレポートを統合し、作成するのにかかる時間は、2時間です」


ダリヤ・ボルディレヴァ (Darya Boldyreva) 氏、FP&A 担当ディレクター、AB InBev 社

OKTA Dark Blue Logo The Duckhorn Portfolio Dark Blue Logo Jollibee Logo Unilab Dark Blue Logo Avanade Dark Blue Logo Ciena Logo

ファイナンス リーダーが信頼するプラットフォームを実際にご体験ください。
Be the next. 

世界中のファイナンス チームが Anaplan で競争をリードしています。ぜひご検討ください。

A laptop displaying a dashboard interface, positioned on a table, showcasing data and analytics.