マーケティング パフォーマンス管理

戦略とリソースを整合させ、マーケティングの意思決定を最適化

マーケティング パフォーマンス管理のための AIドリブンのプランニング・分析・レポーティングソリューション

Dashboard titled Regional Budget Management. Top left shows Budget Allocation Status R3 table with values for FY18 and quarters Q1–Q4, listing Planned Unapproved, Planned Approved (1,223,000), Committed (294,400–270,300), Spent (480,000+), Rejected, Cancelled, Total Forecast (1,223,000–156,000), Total Budget (2,002,528–334,528), and Available Funds (777,528–178,528). Middle chart compares Total Budget, Total Forecast, Excess Funds, and Gap in Funds for FY18 and Q1–Q4 FY18. Right chart shows bar graph for Target vs Forecast with a line for Attainment %. Below, Campaign Budget Requests includes buttons: Create Budget Request, Delete Budget Request, Activities Creation Process, Reset Marketing Budget Requests. Bottom table Budget Request Details lists campaigns (Twitter, SEM, Facebook, YouTube, Reddit, Display, TV, Affiliate Influencer, etc.), aligned initiatives (Brand Consistency, Consumer Centricity), dates, requested funds (50,000–250,000+), expected revenue, and statuses (New, Planned, Released, Approved by CMO, Canceled, Auto Approved, Rejected by Regional Manager).

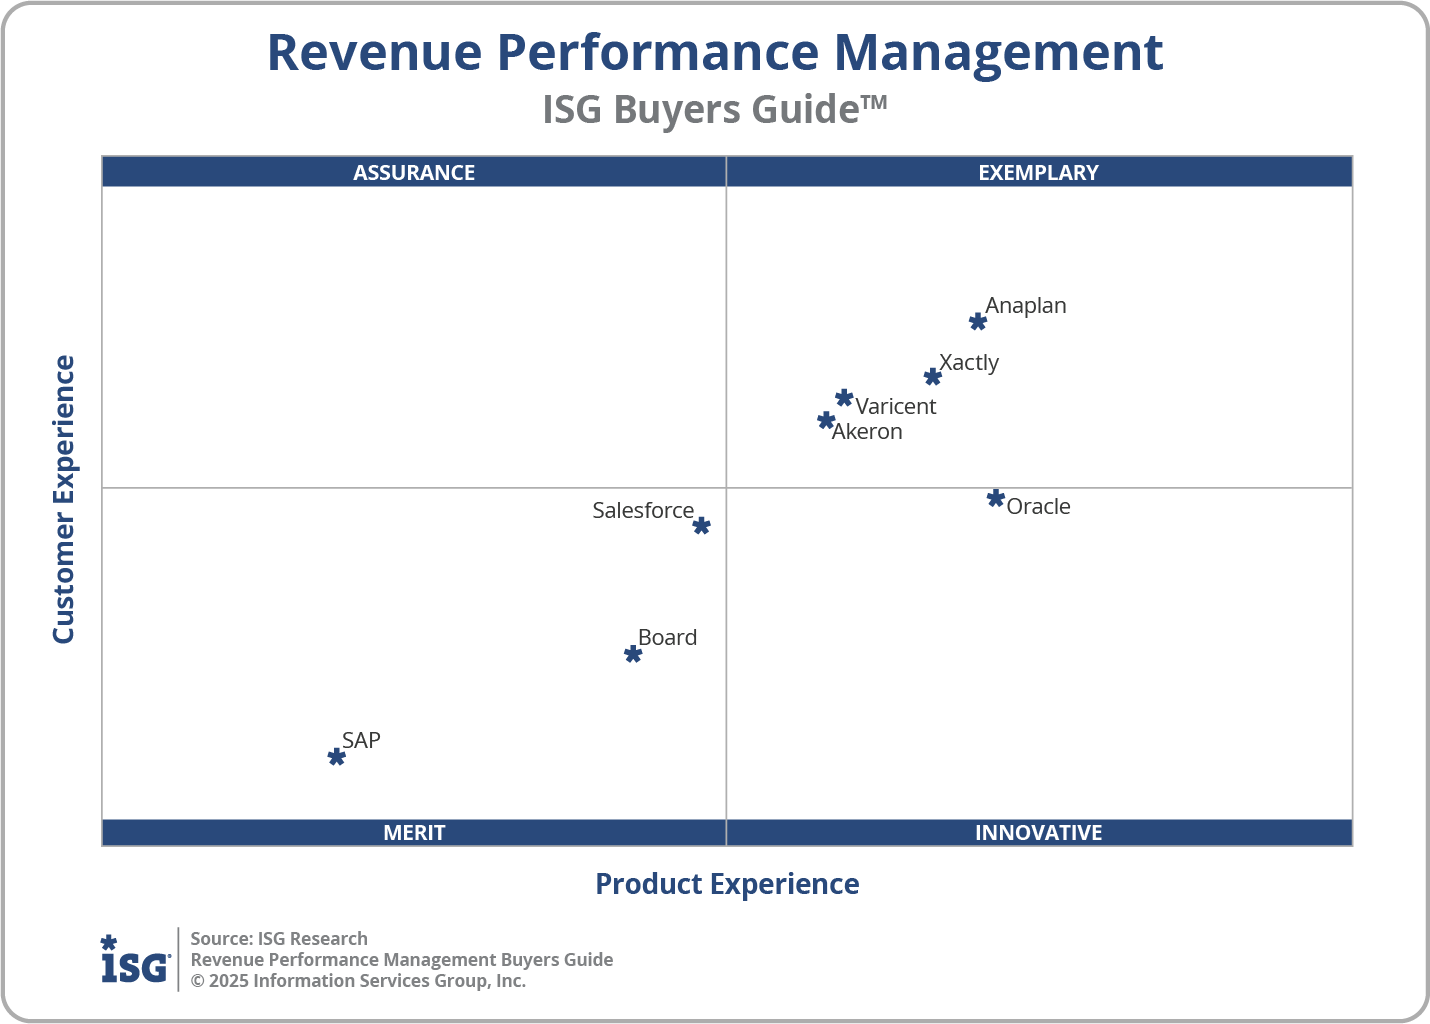
2025 年 ISG リサーチ「収益パフォーマンス管理バイヤーズ ガイド」

Anaplan が再び RPM、ICM、SPM 部門でリーダーに選出された理由と、Anaplan の包括的なプラットフォームや AI に基づくインサイトによって、どのように GTM チームの足並みを揃え、戦略を最適化して、成長を促進できるかをご確認ください。

ISG Revenue Performance Management Buyers Guide 2025 showing Anaplan in the highest point of the Exemplary quadrant

マーケティング パフォーマンスの全体像を把握

Anaplan はファイナンシャル ガバナンスから戦略的プランニング、パフォーマンスに関するインサイトまで、マーケティング組織全体を連携させる包括的な機能群を提供します。
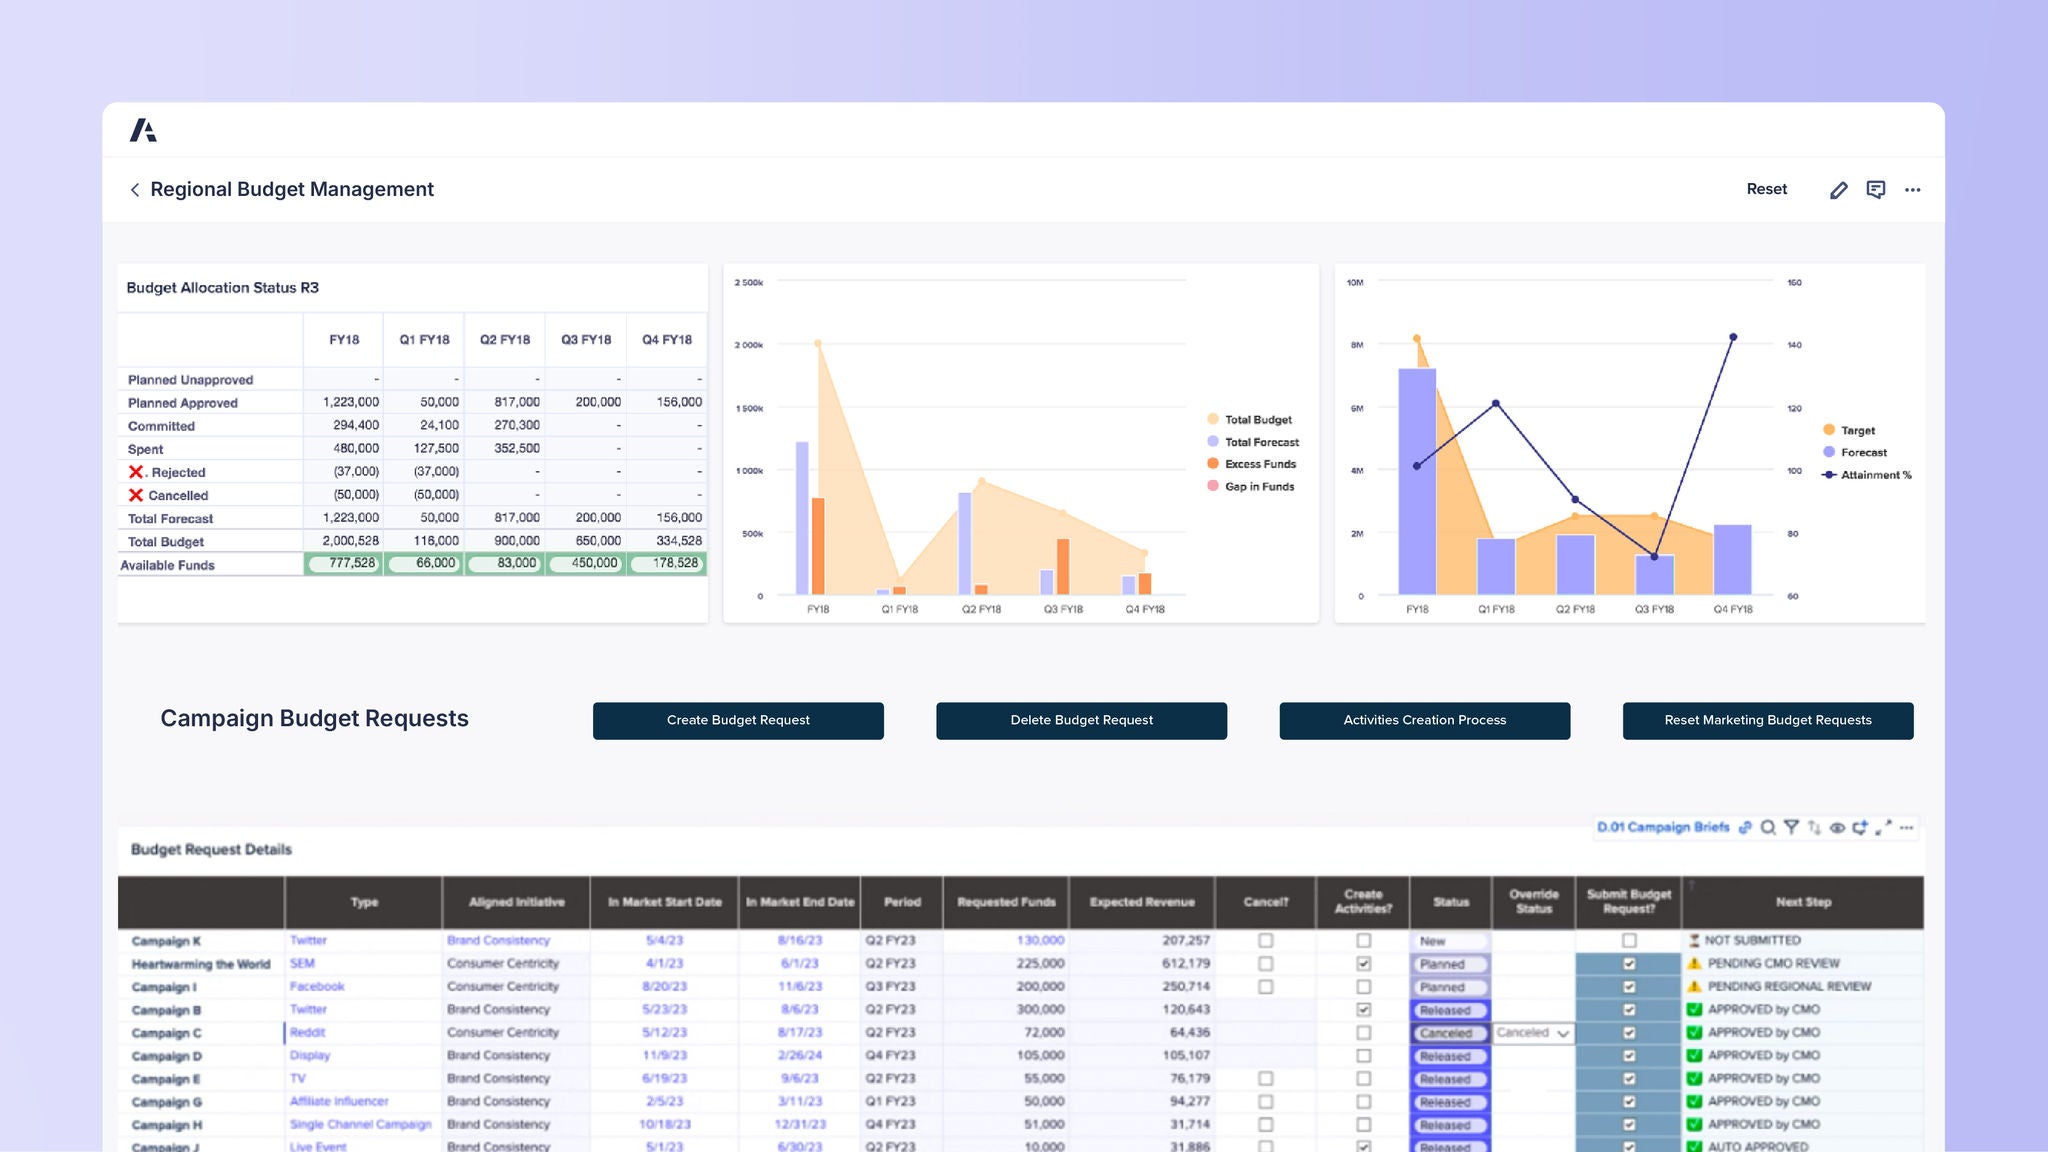
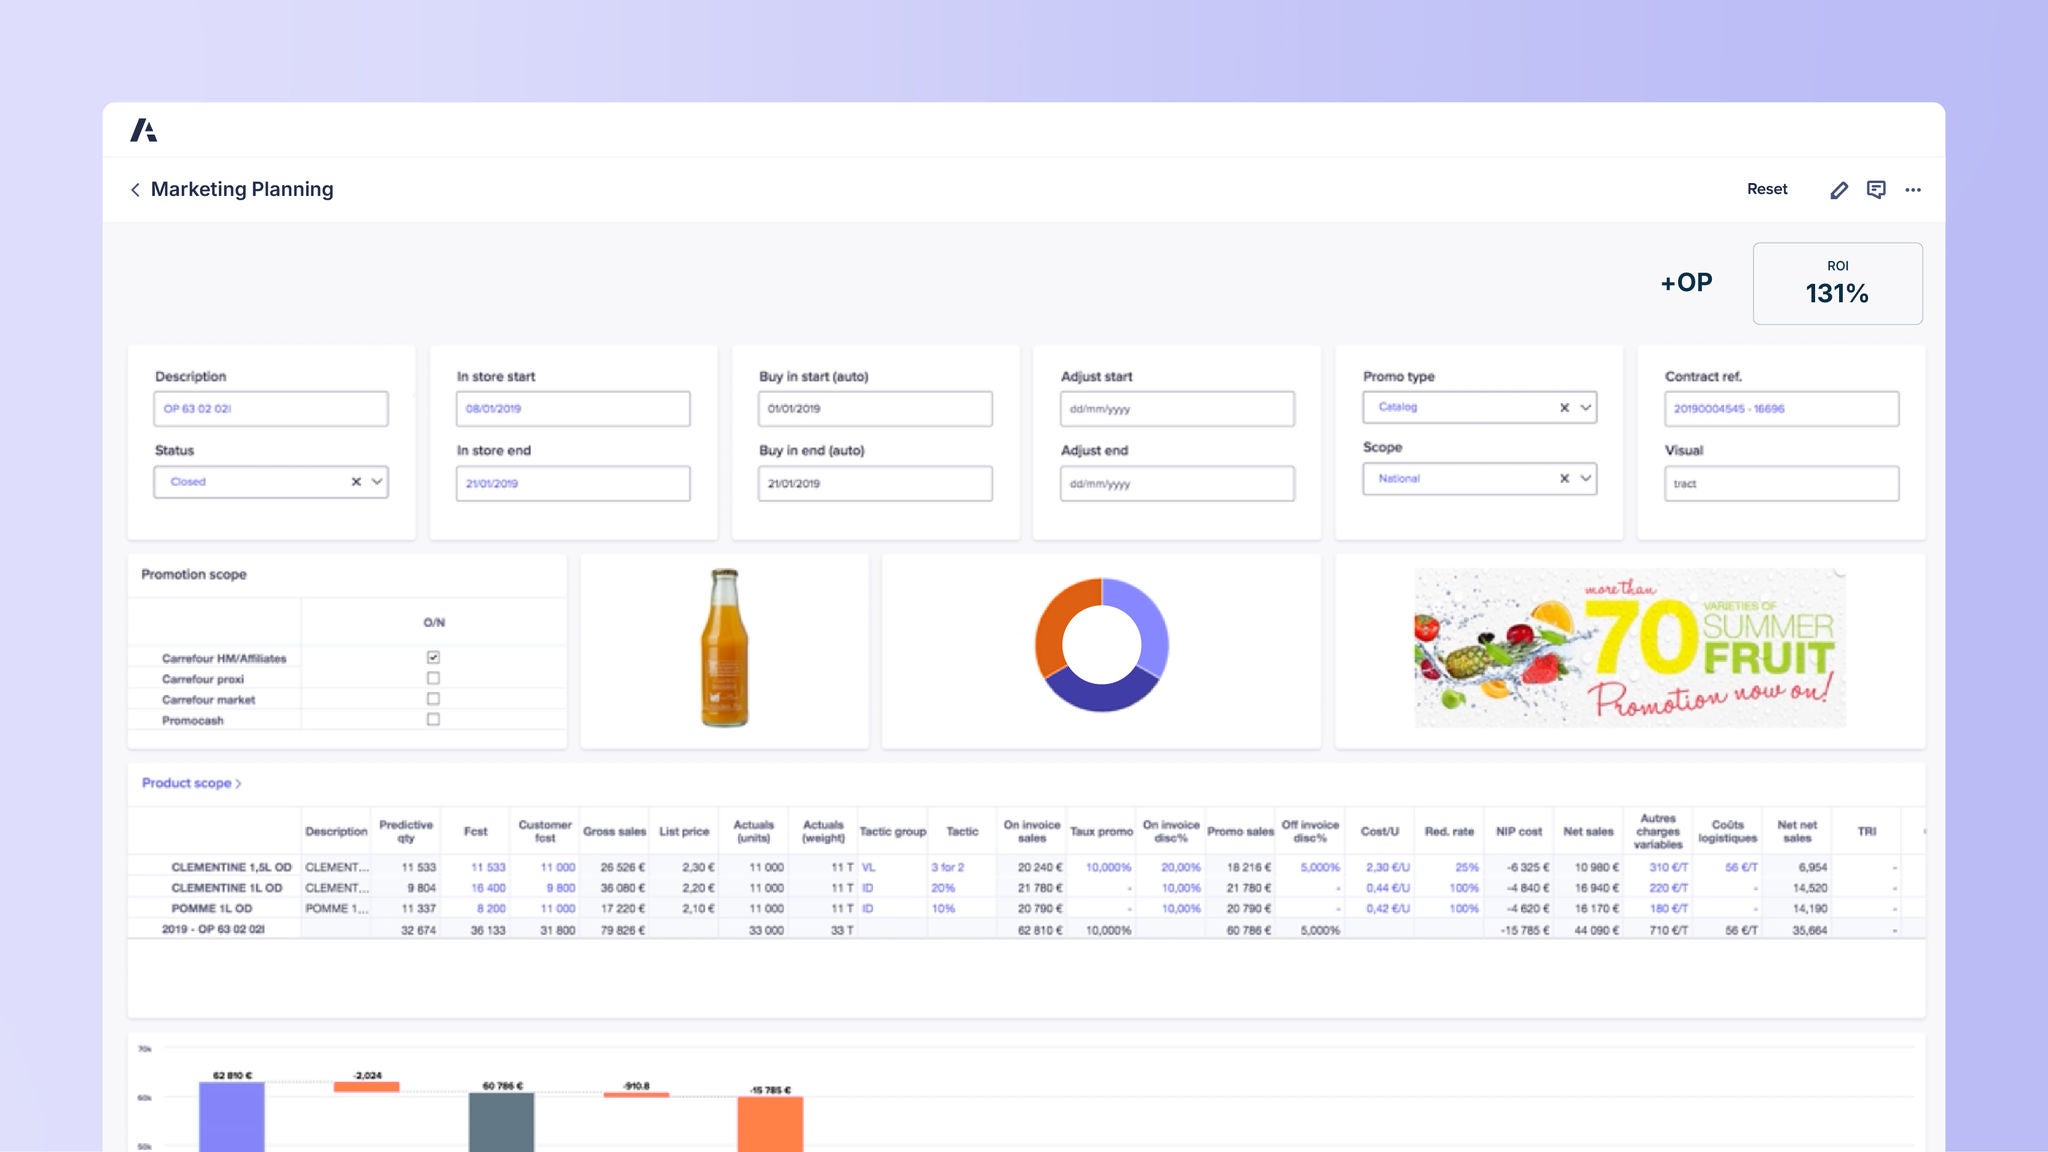
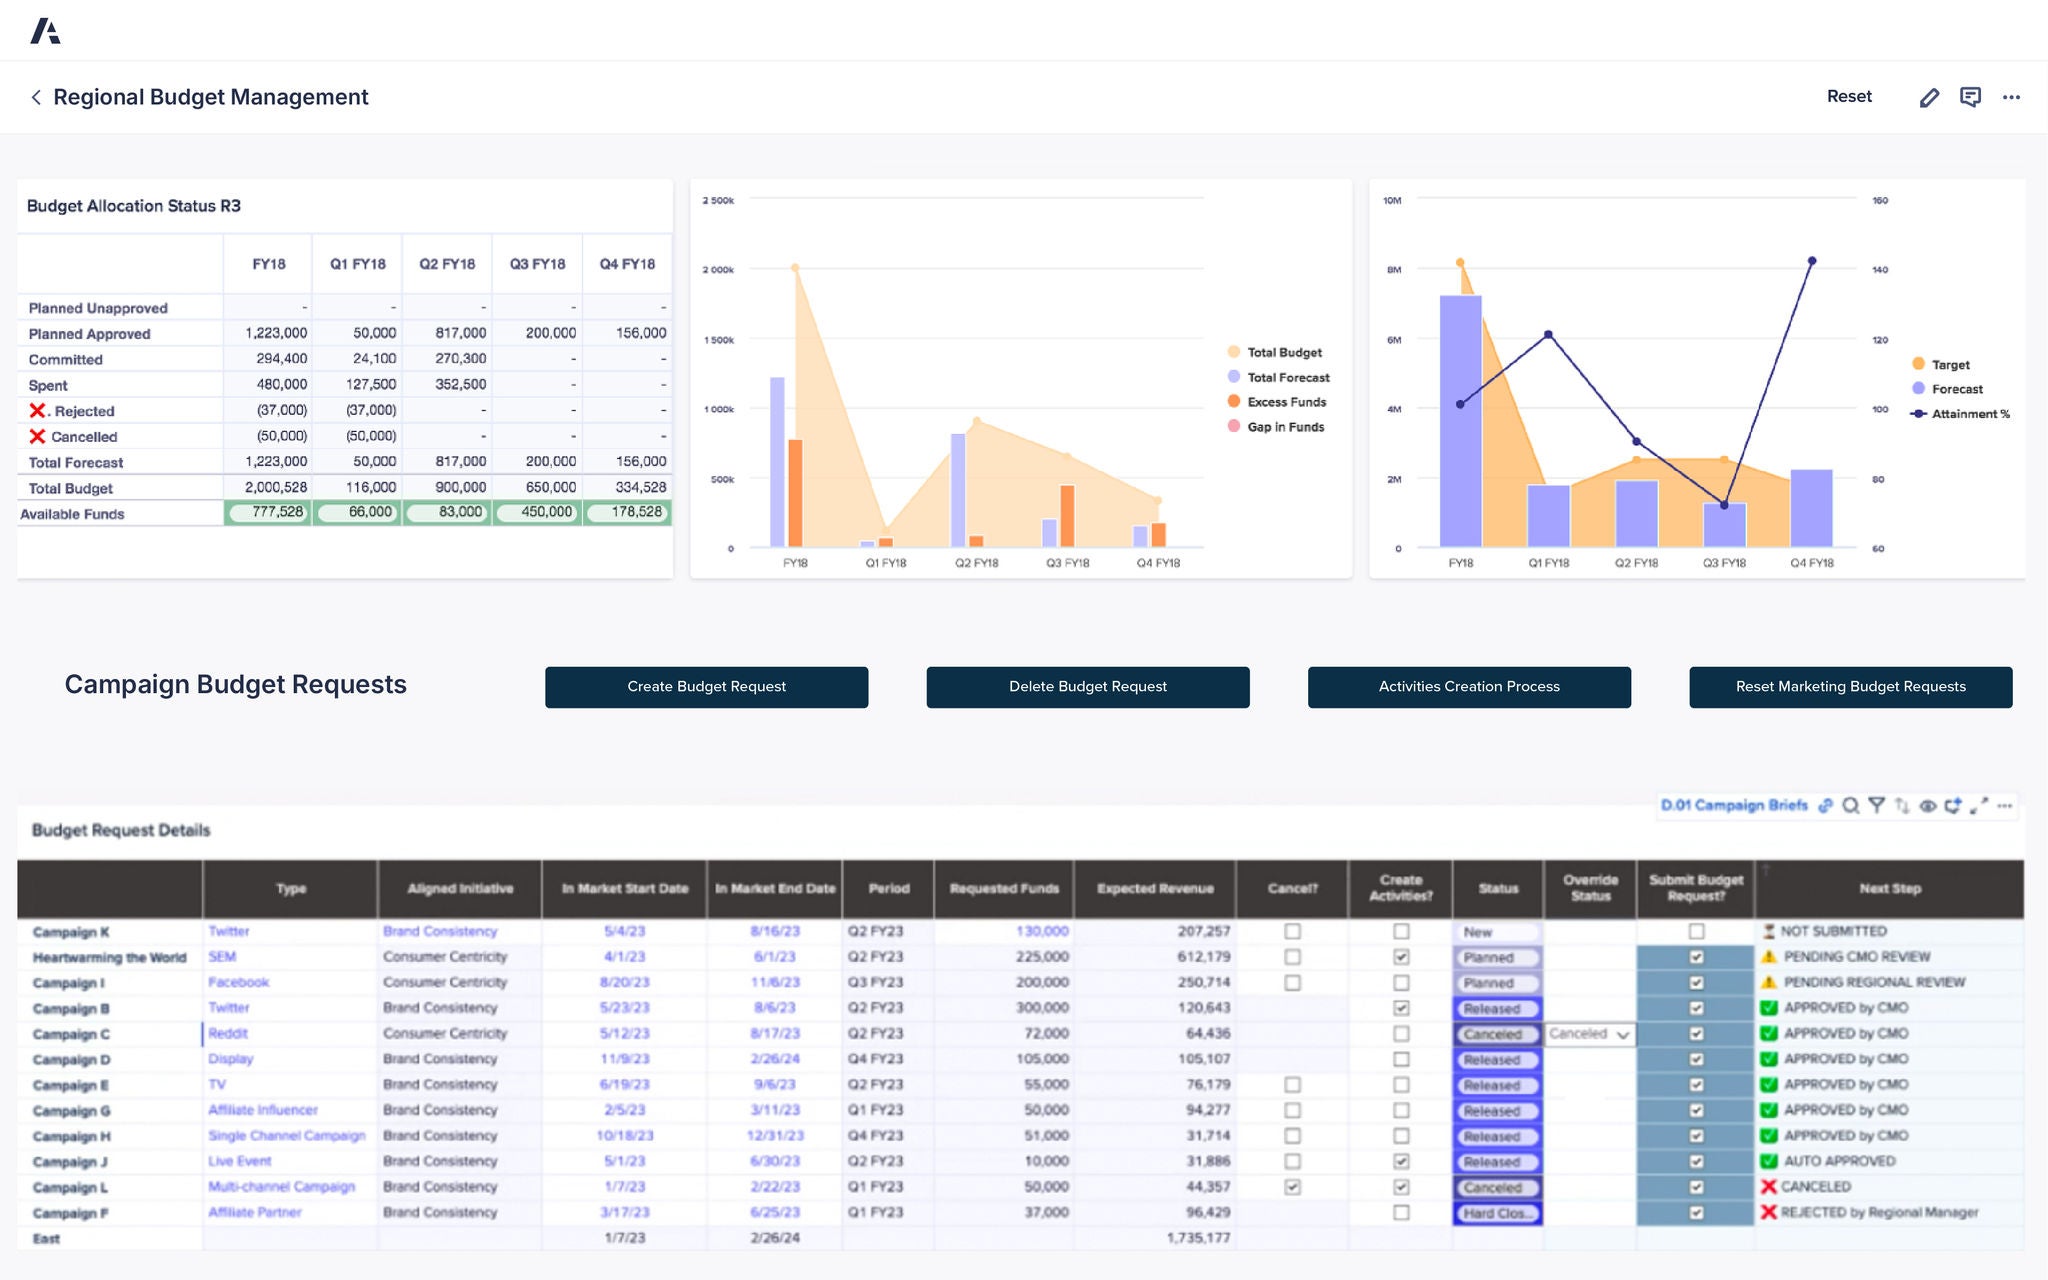
Dashboard titled Marketing Planning. Fields include Description OP 63 02 021, Status Closed, Buy in start 05/01/2019, In store start 08/01/2019, Buy in end 21/01/2019, Adjust start and end blank, Promo type Catalog, Scope National, Contract reference 2019004565-16696, Visual tract. Promotion scope lists Carrefour HM/Affiliates checked, others unchecked. Visuals include product image of a juice bottle, pie chart, and promotion banner reading 'More than 70 varieties of summer fruit promotion now on!' Product scope table includes Clementine 1.5L, Clementine 1L, and Pomme 1L with predictive quantity, cost, gross sales, list price, promo sales, on invoice discounts, net sales, and TRI. Bottom section shows bar chart comparing product-level net sales and promotional impact.

マーケティング プランニング

動的なワークフローと承認プロセスにより、より多くのキャンペーン、プログラム、施策を計画および実行できます。

Dashboard titled Marketing Insights & Forecasting. Section heading Marketing ROI Review. Regional ROI table shows: US Central investments 1,803,000, revenue 9,973,333, ROI 553%; US West investments 2,163,000, revenue 10,712,967, ROI 495%; US East investments 2,777,000, revenue 12,211,967, ROI 440%; US South investments 1,682,000, revenue 6,521,300, ROI 329%; Americas investments 8,405,000, revenue 38,419,567, ROI 469%. Campaign ROI table includes Beauty Influencer Contest, Affiliate Awards, Spring Bloom, Digital Summer, Holiday Gift Ideas, Independence Day Promo with campaign investment, attributed revenue, ROI %, target ROI %, variance, and regional and national rank. Right side shows Regional ROI chart with orange bars for revenue, blue bars for investment, and red line indicating ROI % across regions.

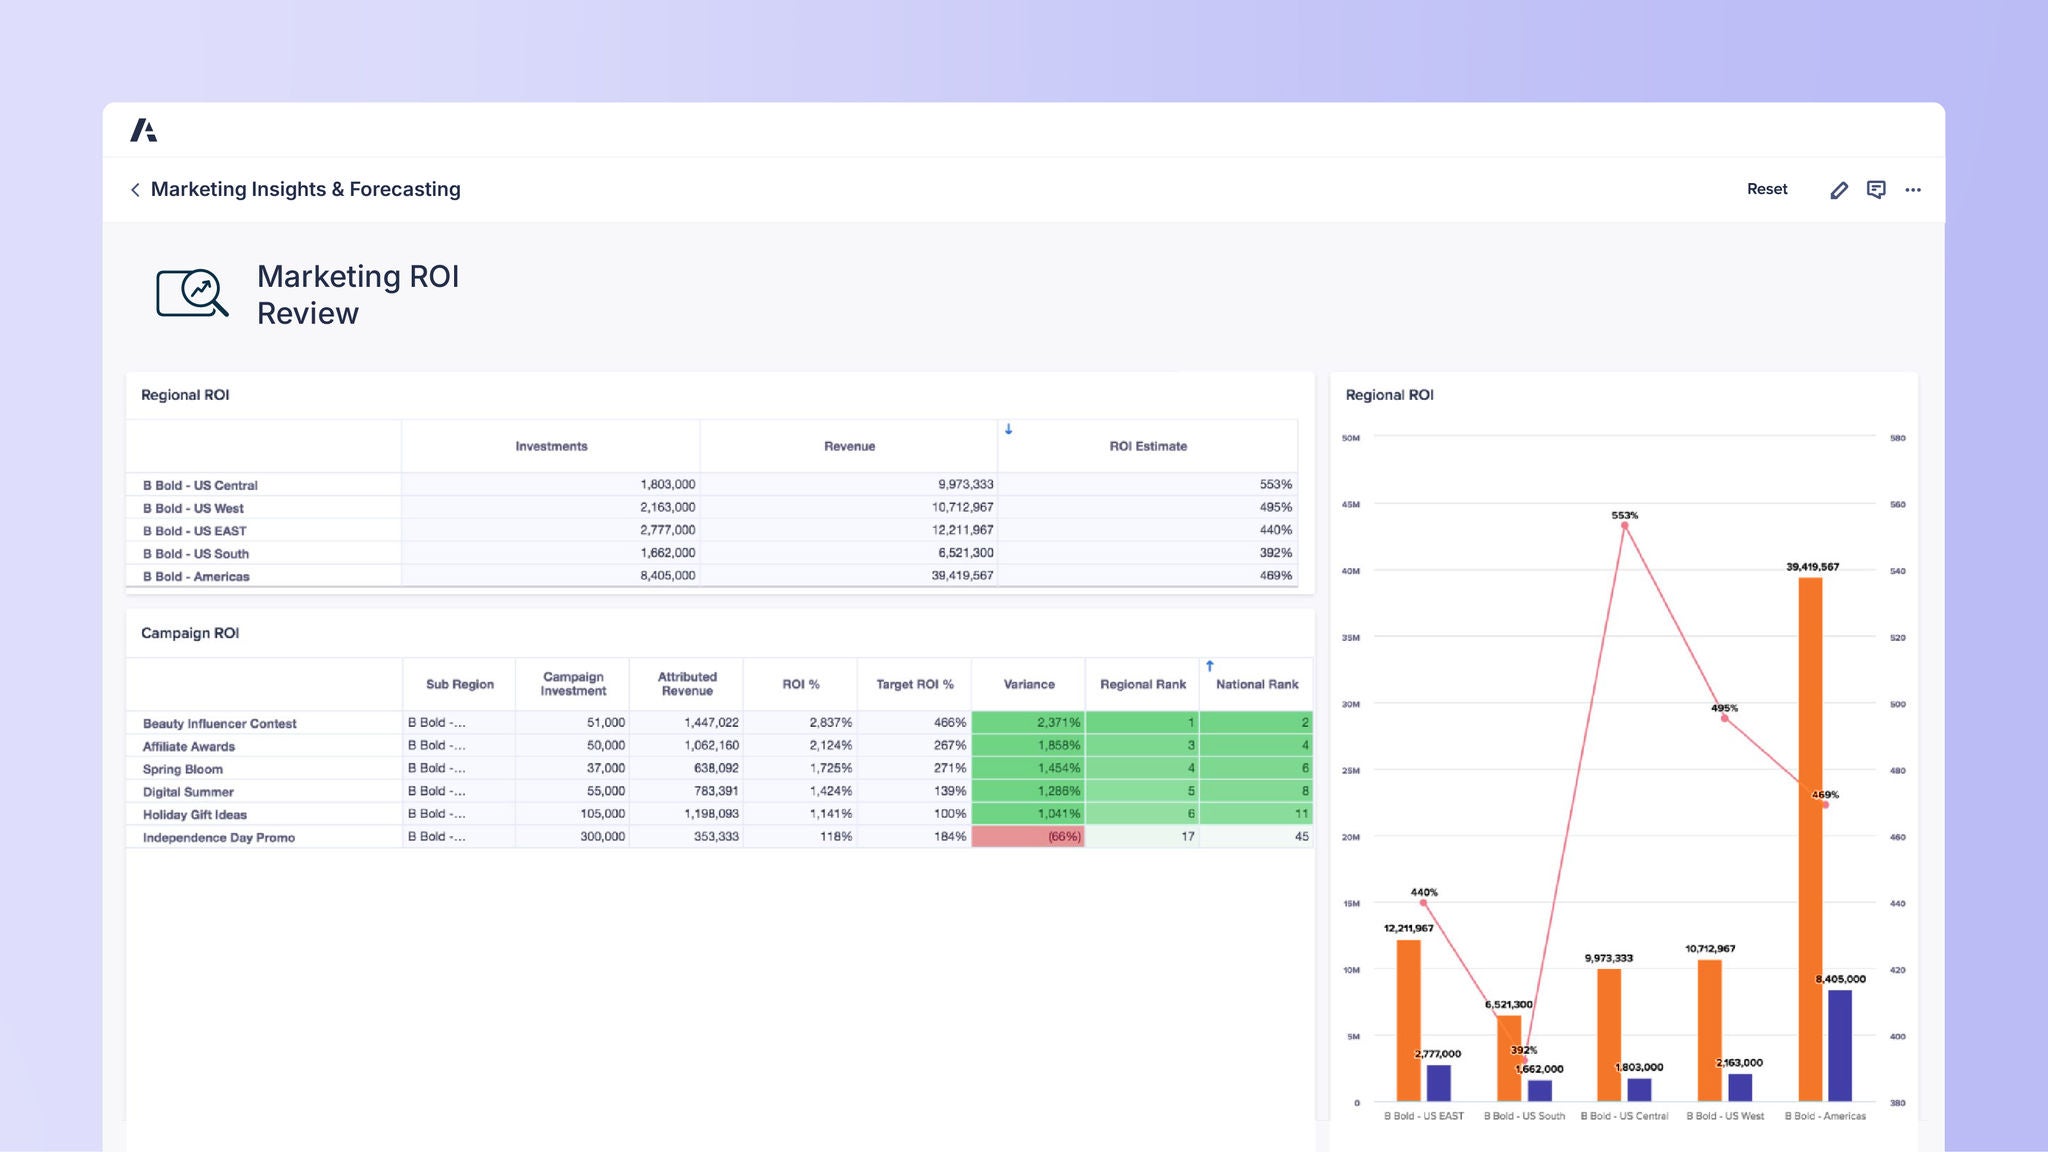
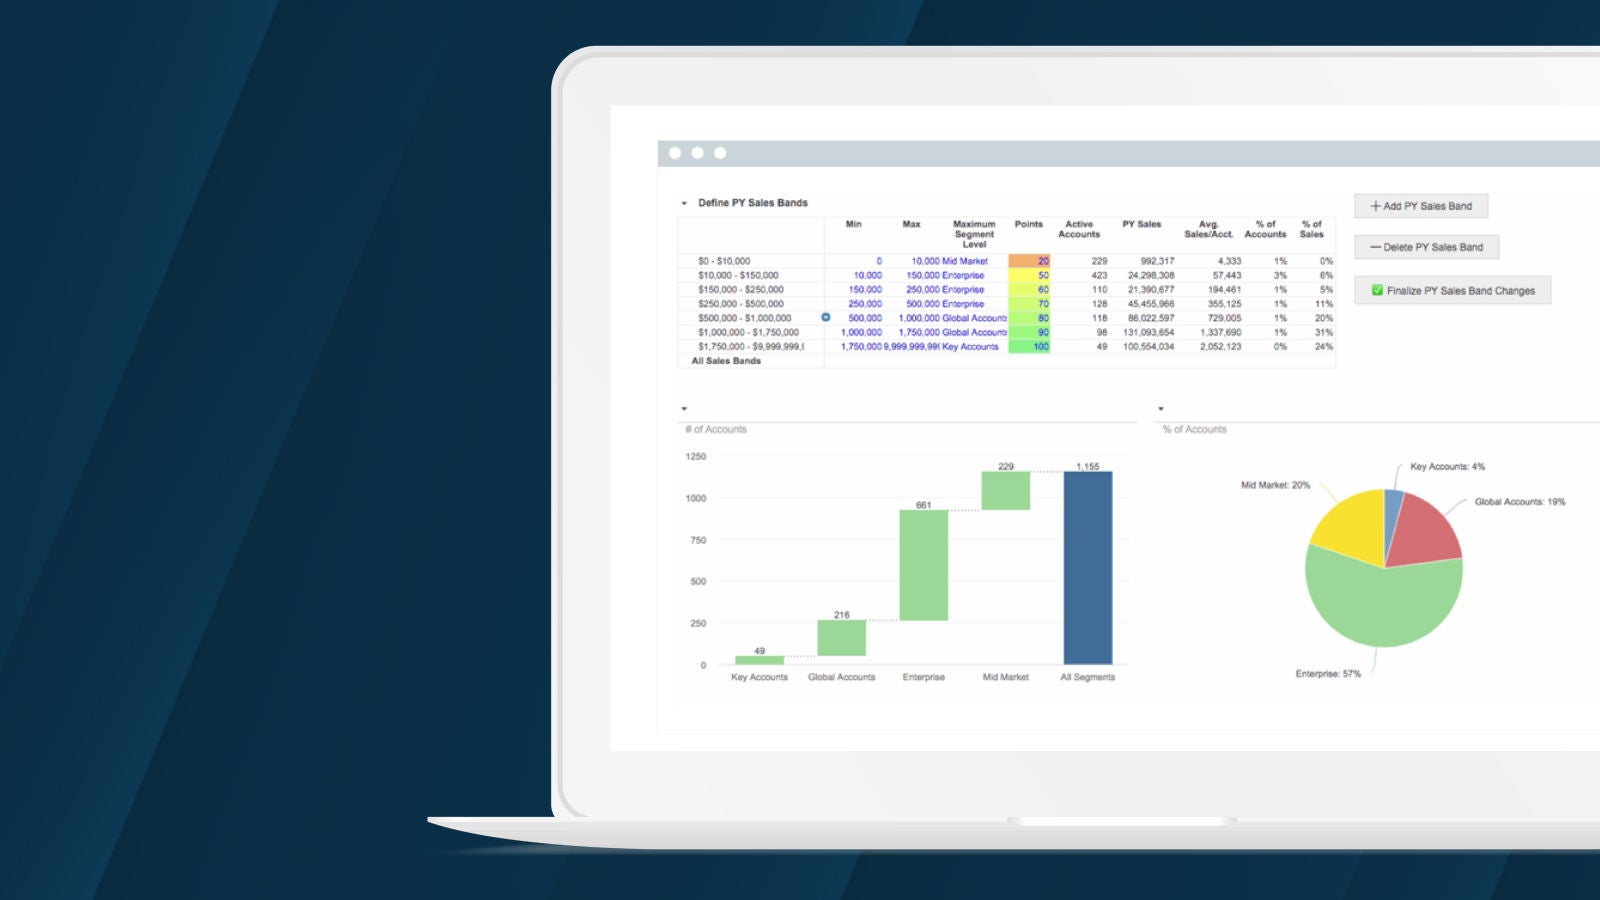
マーケティング インサイト及びフォーキャスト

事後対応型のレポート作成から脱却し、データドリブンな意思決定によるクローズドループ型マーケティングに移行しましょう。

大手企業のマーケティング部門のリーダーが Anaplan でプランニングをしています


マーケティング リーダーが信頼するプラットフォームを実際にご体験ください。
Be the next.

世界中のマーケティング チームが Anaplan でコネクテッド エンタープライズを実現しています。ぜひご検討ください。

A laptop displaying a dashboard interface, positioned on a table, showcasing data and analytics.