Kapazitätsplanung in der Supply Chain

KI-gestützte Lösungen
für die Kapazitätsplanung
in der Supply Chain

Verbessern Sie Servicelevel, senken Sie Kosten und minimieren Sie Risiken mit intelligenter, szenariobasierter Kapazitätsplanung.

An Anaplan dashboard titled “Production Plan Capacity View” under the Capacity Planning module, displaying resource utilization and production capacity across fiscal weeks FY24. The top chart visualizes “Capacity Limit – Regular” in light blue, “Capacity Limit – Overtime” in purple, and “Total Production Capacity Required” in orange bars for the process “Make Full Fat Milk at Main Dairy Plant.” The bottom bar chart further breaks down weekly production volume and utilization. A table below lists data points such as production volume, production capacity required, capacity utilization percentage, and spare available capacity for each week, showing utilization peaking at 49% in Week 37 FY24. Sidebar controls on the left include filters for time periods, critical resources, and buttons labeled “Run Optimizer,” “Process Run-Time Data,” “Capacity Planning,” “Constrained Resources,” and “Missed Demand due to Resource.”

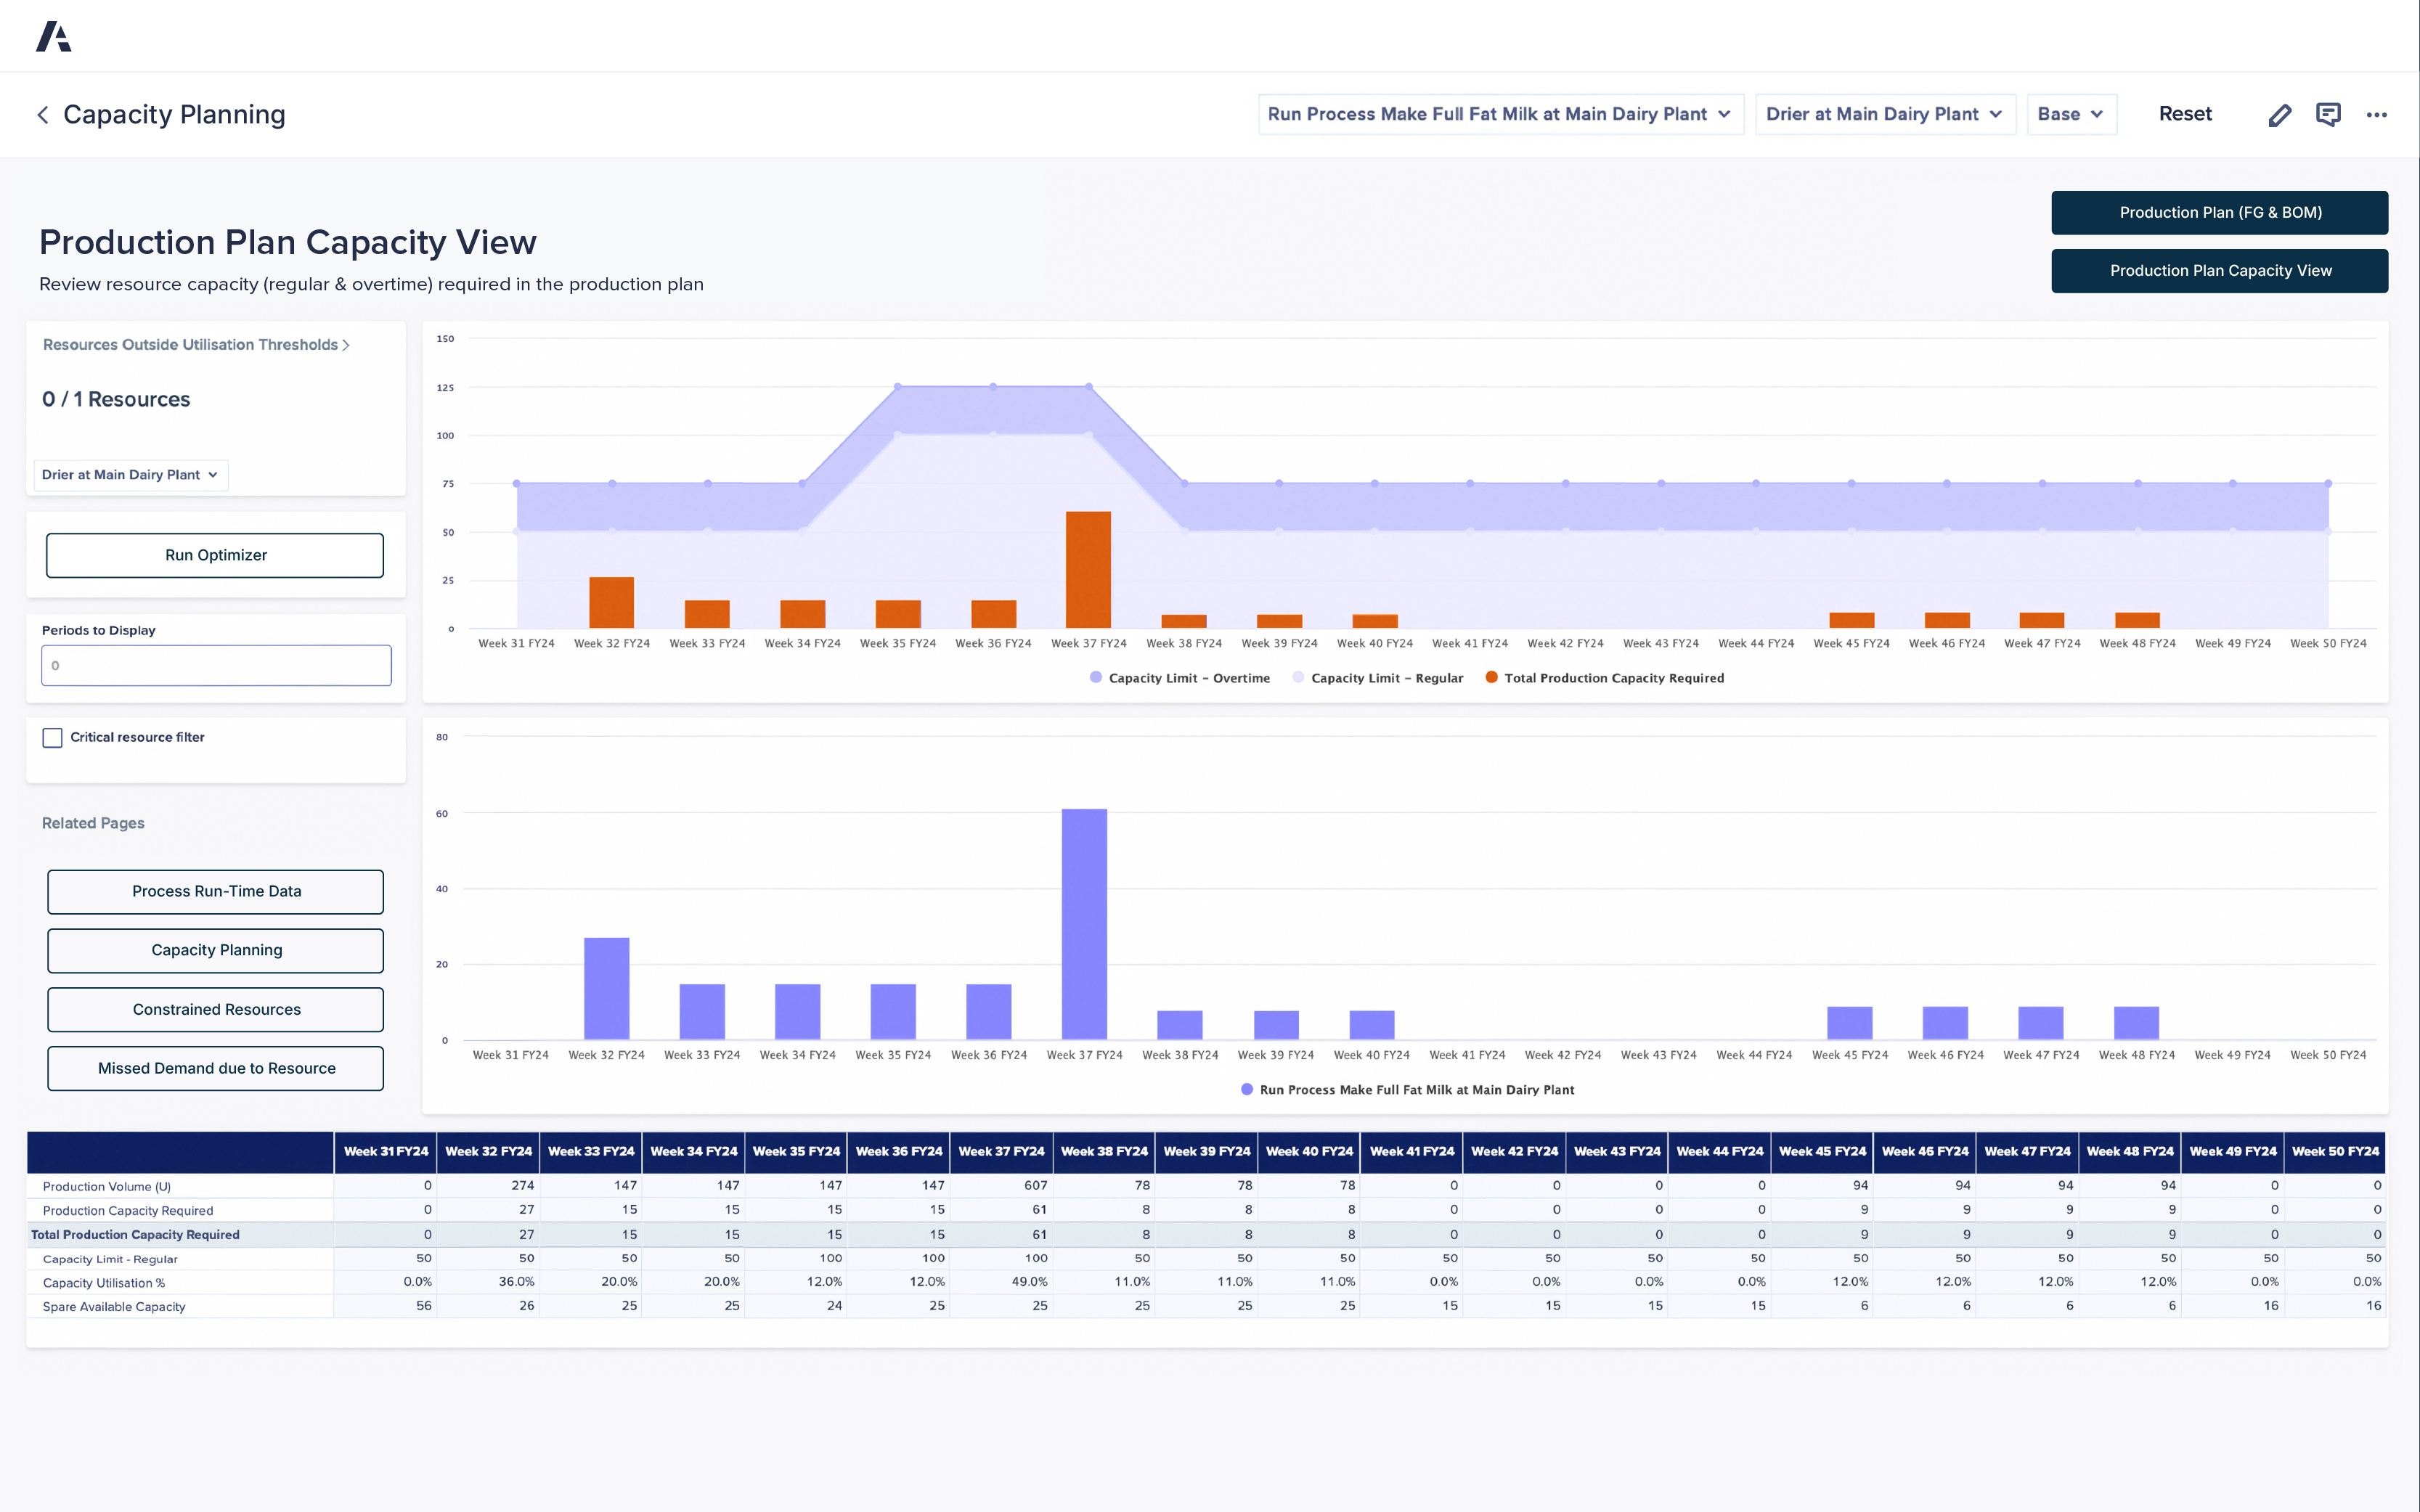
Anaplan Applikation für die Angebotsplanung

Vernetzen Sie Ihre gesamte Supply Chain mit einer speziell entwickelten Applikation, um die Produktions- und Kapazitätsplanung zu optimieren.

An Anaplan Production Planning Application dashboard showing capacity utilization and production requirements by location and process. The top section contains an organizational chart summarizing “All locations” with an average regular utilization of 75% and 4,327 underutilized periods, branching into “Reading” and “Birmingham” with utilization rates of 81% and 70% respectively. Subsections include Body Shop, Paint Shop, and Trim/Chassis Shop for each location, showing utilization percentages ranging from 52% to 100%. Below, bar and line charts display monthly production capacity data from January 2024 to August 2025. Blue bars represent total production capacity required, with darker blue and red lines indicating regular and overtime capacity limits. The lower chart compares production processes, such as “Make Discovery Exclusive Trim at Reading,” “Make Range Rover Panels,” and “Make Defender Windows.” Buttons and filters on the left include “Run Optimizer,” “Resource Capacity Required,” “Capacity Planning,” and “Missed Demand due to Resource.” The layout provides detailed, labeled data visualizations for accessible interpretation

„Unser Geschäft ist deutlich komplexer geworden ... Um dieser Entwicklung gerecht zu werden, braucht es eine eng verzahnte Planung und Abstimmung von Nachfrage, Angebot und Unternehmensstrategie. Die Fähigkeit, uns schnell und effizient anzupassen ist entscheidend für unseren Erfolg.“


Angela Ying, Vice President of Business Operations, NVIDIA

Nvidia Logo

Entdecken Sie die Plattform, der führende Supply-Chain-Experten vertrauen. Worauf warten Sie?

Supply-Chain-Teams auf der ganzen Welt vertrauen auf Anaplan, um ihr Unternehmen zu modernisieren und zu vernetzen. Wie steht es mit Ihnen?

A laptop displaying a dashboard interface, positioned on a table, showcasing data and analytics.