From headcount to high impact - explore how C-suite can turn workforce planning into an enterprise-wide growth strategy.

Headcount expense planning
Confidently predict people costs.
Translate talent plans to financial plans.
Give finance the agility and accuracy to plan, forecast, and manage headcount expenses in real time — aligning workforce and financial strategies.
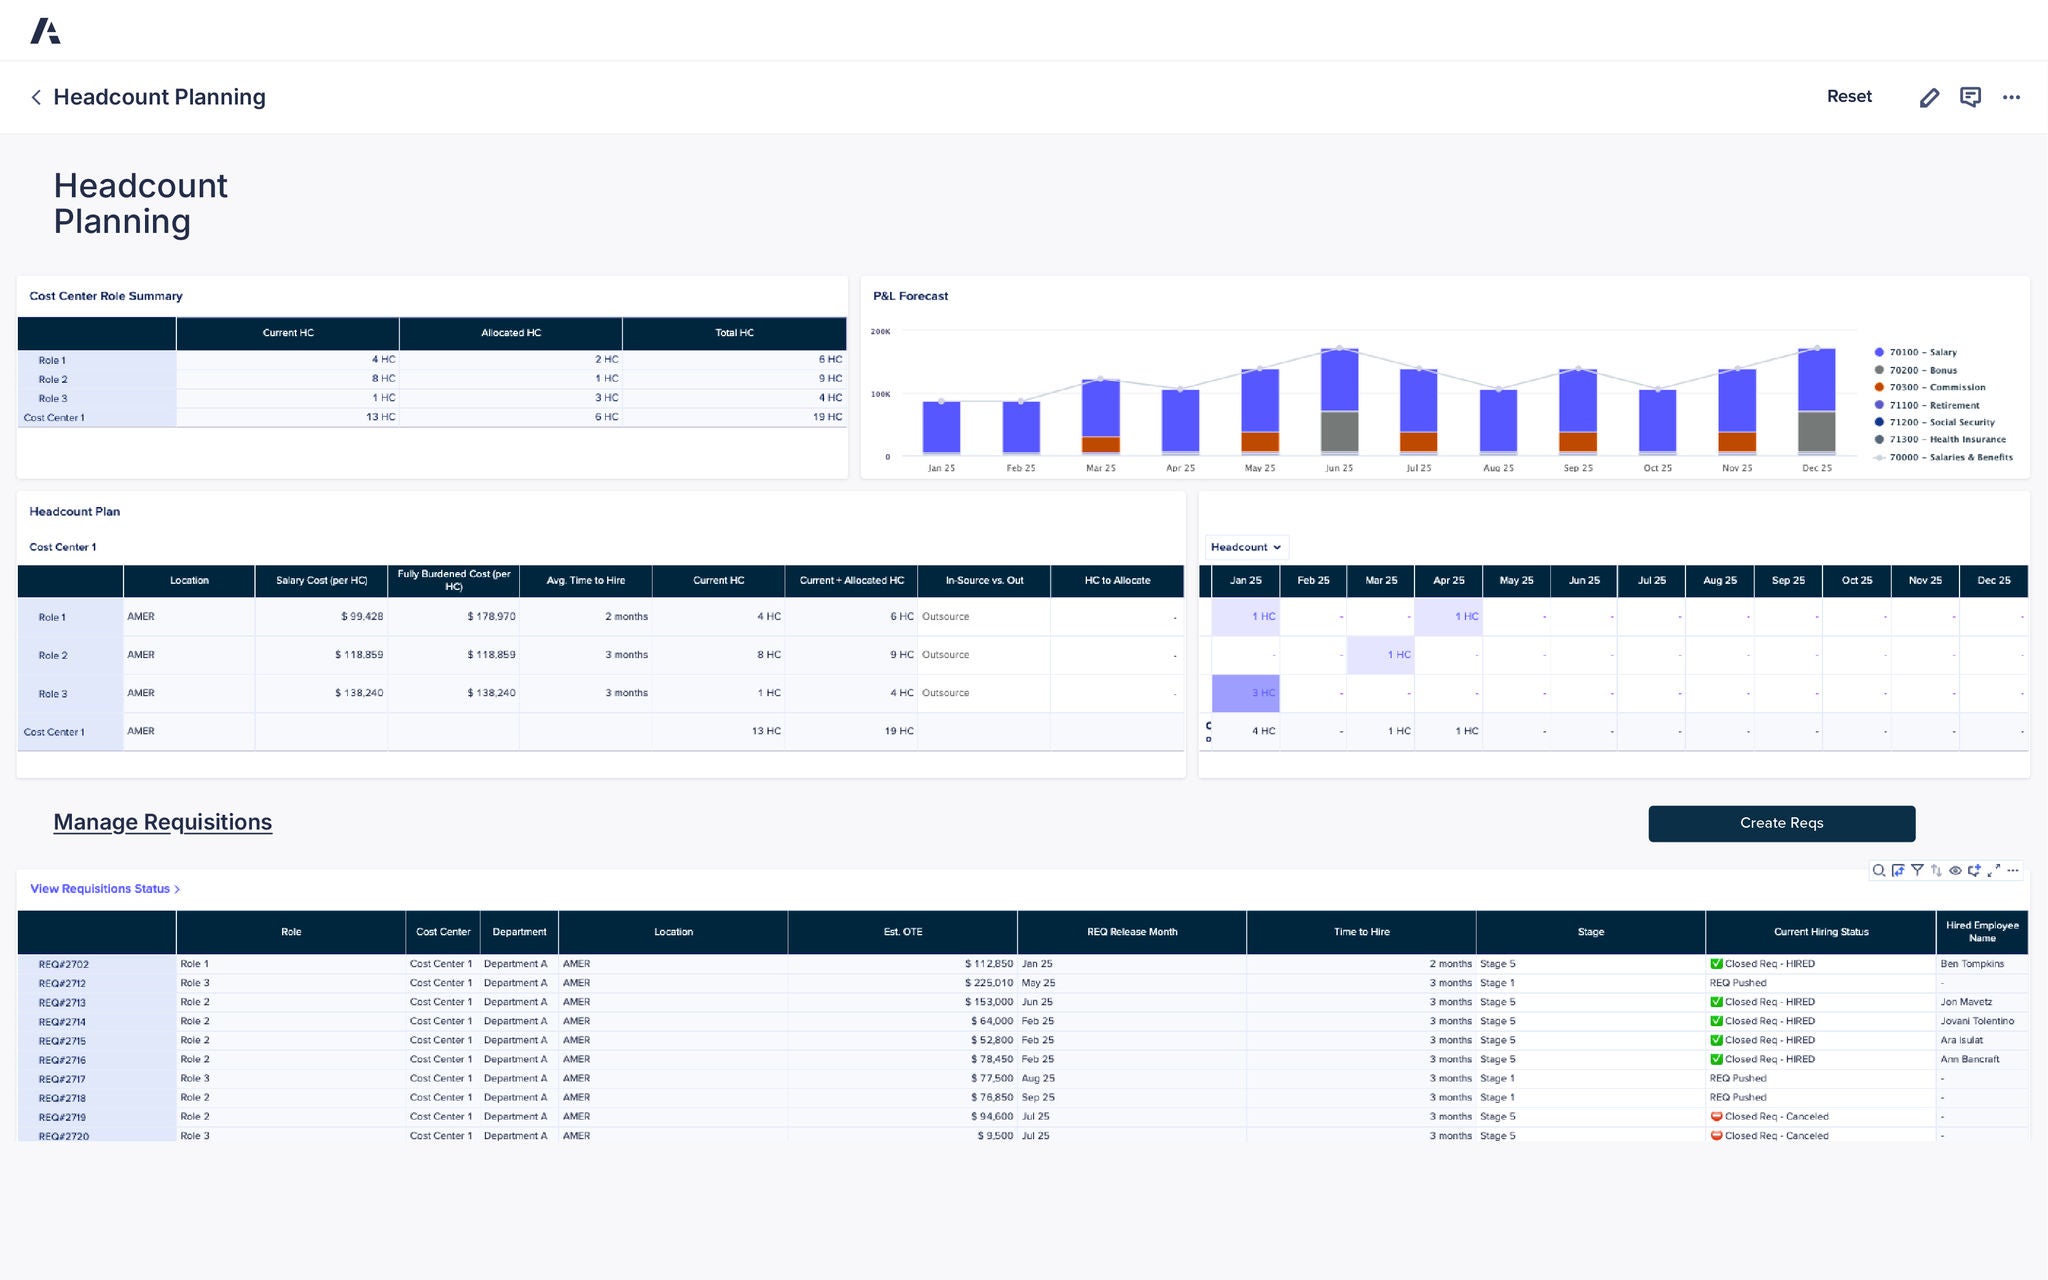
Take control of your headcount expenses with connected financial planning
Gain real-time visibility into salaries, benefits, and other workforce costs so you can budget accurately, forecast confidently, and align spend with strategy.
2025 Gartner® Magic Quadrant™ for Financial Planning Software
Anaplan named a 9X Leader in the 2025 Gartner® Magic Quadrant™ for Financial Planning Software and recognized for ability to execute and completeness of vision.

Plan and forecast headcount expenses with clarity, control, and confidence
Align your headcount expenses with your business goals using real-time data, driver-based models, and connected collaboration.

“We're using Anaplan to show our open roles and cost per employee — for actual and forecast periods — including people in our recruiting system who we plan to hire in the future.”
Solutions Architect, Outreach.io
Featured resources
Best practices and valuable insights to spark new ideas and modernize your headcount expense planning.


Discover the platform finance leaders trust.
Be the next.
Finance teams around the world rely on Anaplan to outpace the competition. Shouldn't you?
