Supply chain long-range planning

Intelligent solutions for supply chain
long-range planning

Build future-ready supply chain strategies with advanced analytics.
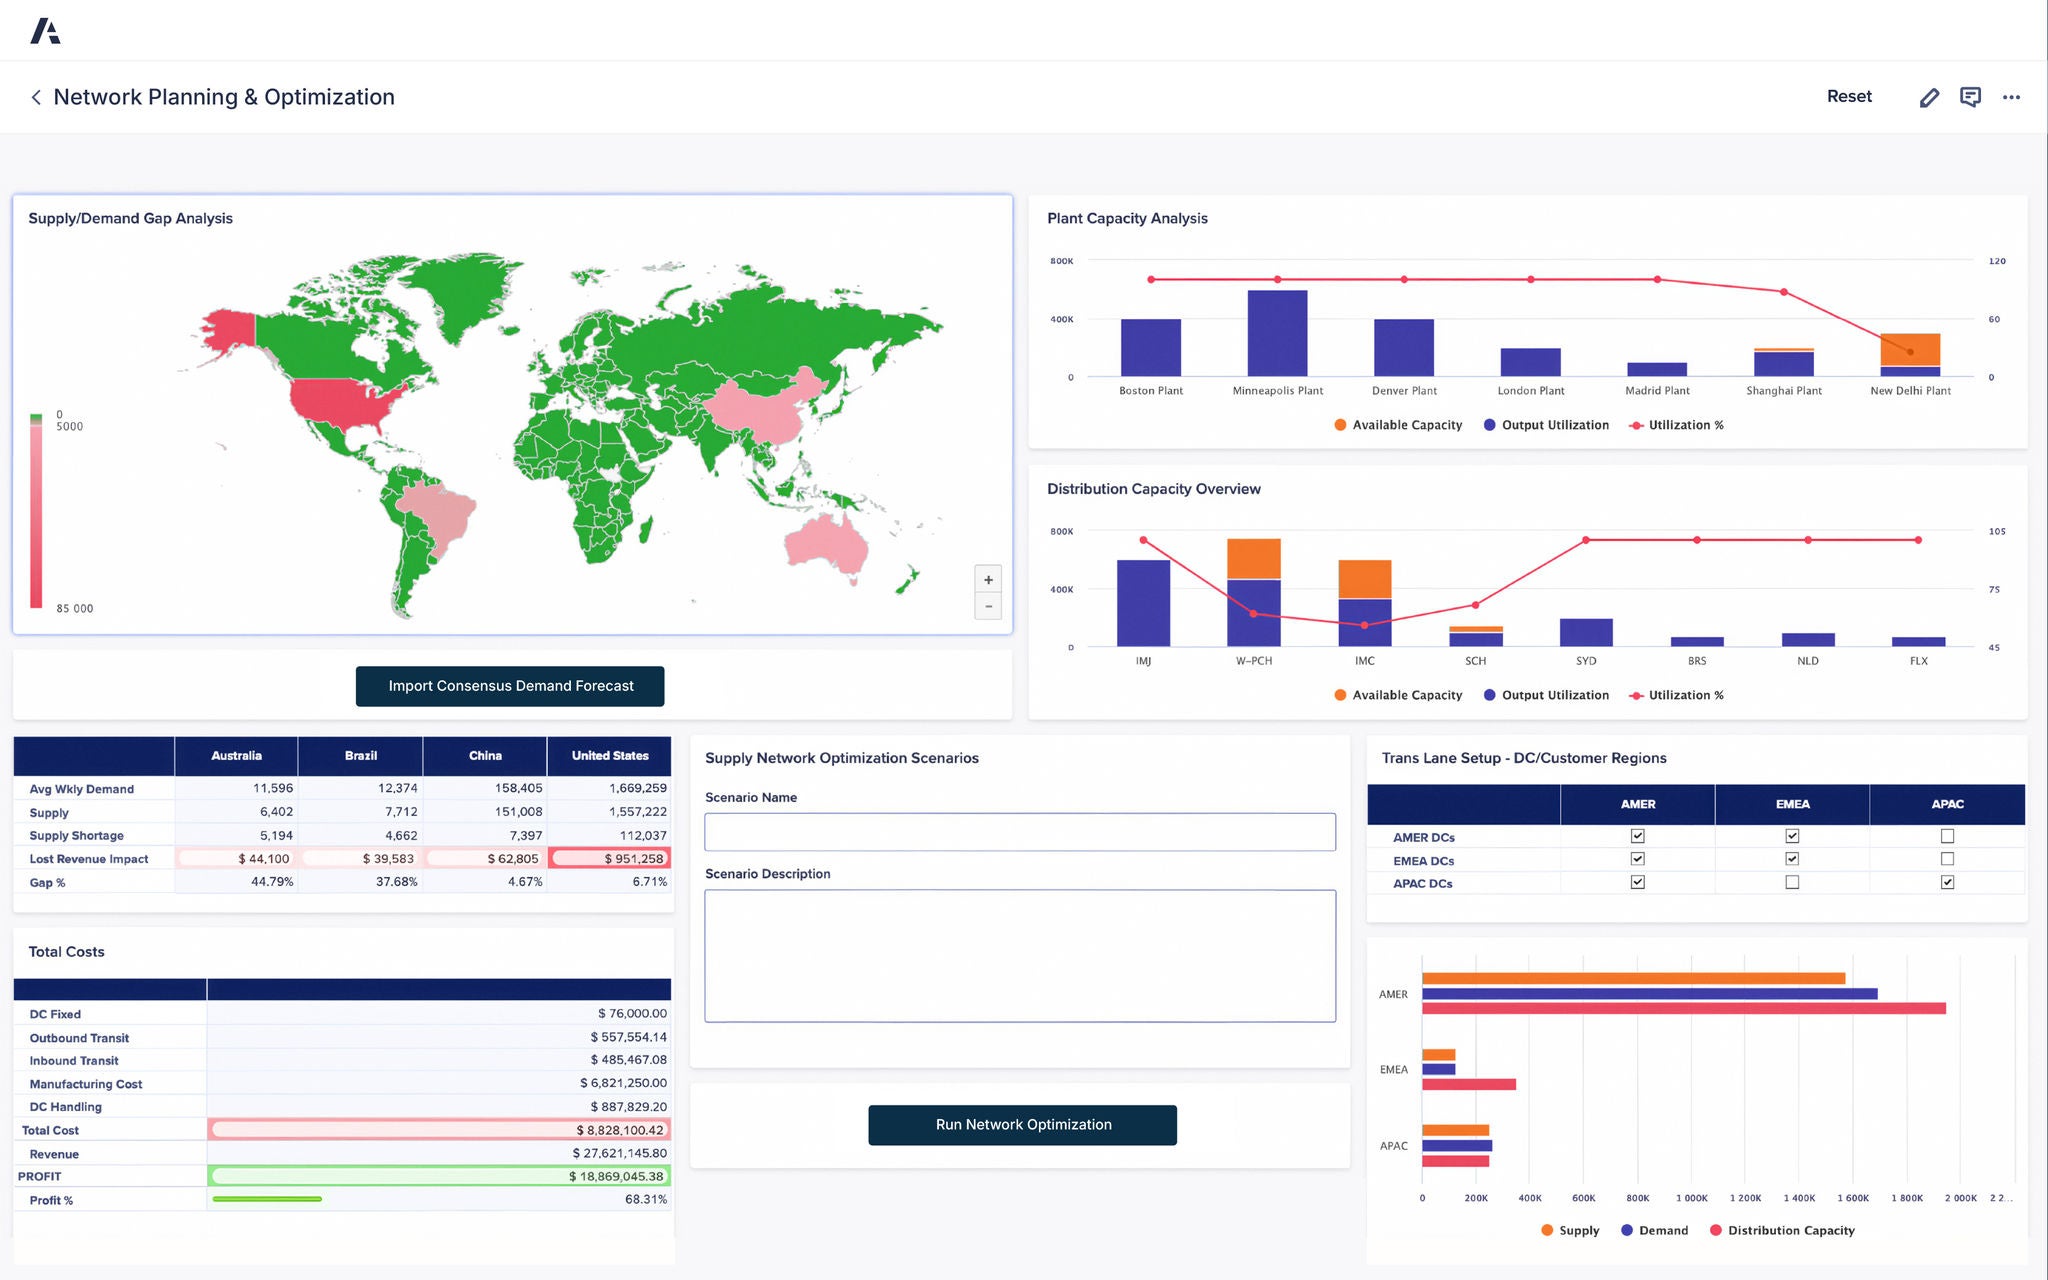
An Anaplan dashboard titled “Network Planning & Optimization,” visualizing global supply chain performance and capacity metrics. The top left section displays a world map labeled “Supply/Demand Gap Analysis,” color-coded to show supply shortages in red and surpluses in green across regions such as the United States, Brazil, China, and Australia. Adjacent panels include “Plant Capacity Analysis” and “Distribution Capacity Overview,” with bar and line charts comparing available capacity, output utilization, and utilization percentages across facilities like Boston, Denver, and New Delhi plants. The lower section features a “Total Costs” table summarizing DC fixed, transit, manufacturing, and handling costs, alongside revenue, total cost, profit, and profit percentage. A “Supply Network Optimization Scenarios” box allows users to enter scenario names and descriptions, while a “Trans Lane Setup – DC/Customer Regions” chart outlines distribution coverage across AMER, EMEA, and APAC regions with bar graphs comparing supply, demand, and distribution capacity.

2026 ISG Buyers Guide™ for Supply Chain Planning

For the second consecutive year, Anaplan is recognized as the top Exemplary Vendor for our leadership in AI-driven supply chain planning.

Anaplan analyst report on 2026 ISG Buyers Guide™ for Supply Chain Planning, with the Anaplan and ISG logos on a white and dark blue graphic background.
Soft Blue to Cream Gradient Background

“We need to make good decisions today for tomorrow — especially in our business, which is a long-term business… That's why we need to make decisions fast, with accurate data, today.”


Emmanuel Kuranty, Finance Business Partner, Orano

Orano Logo

Discover the platform supply chain leaders trust. Be the next.

Supply chain teams around the world rely on Anaplan to build a modern, connected enterprise. Shouldn’t you? 
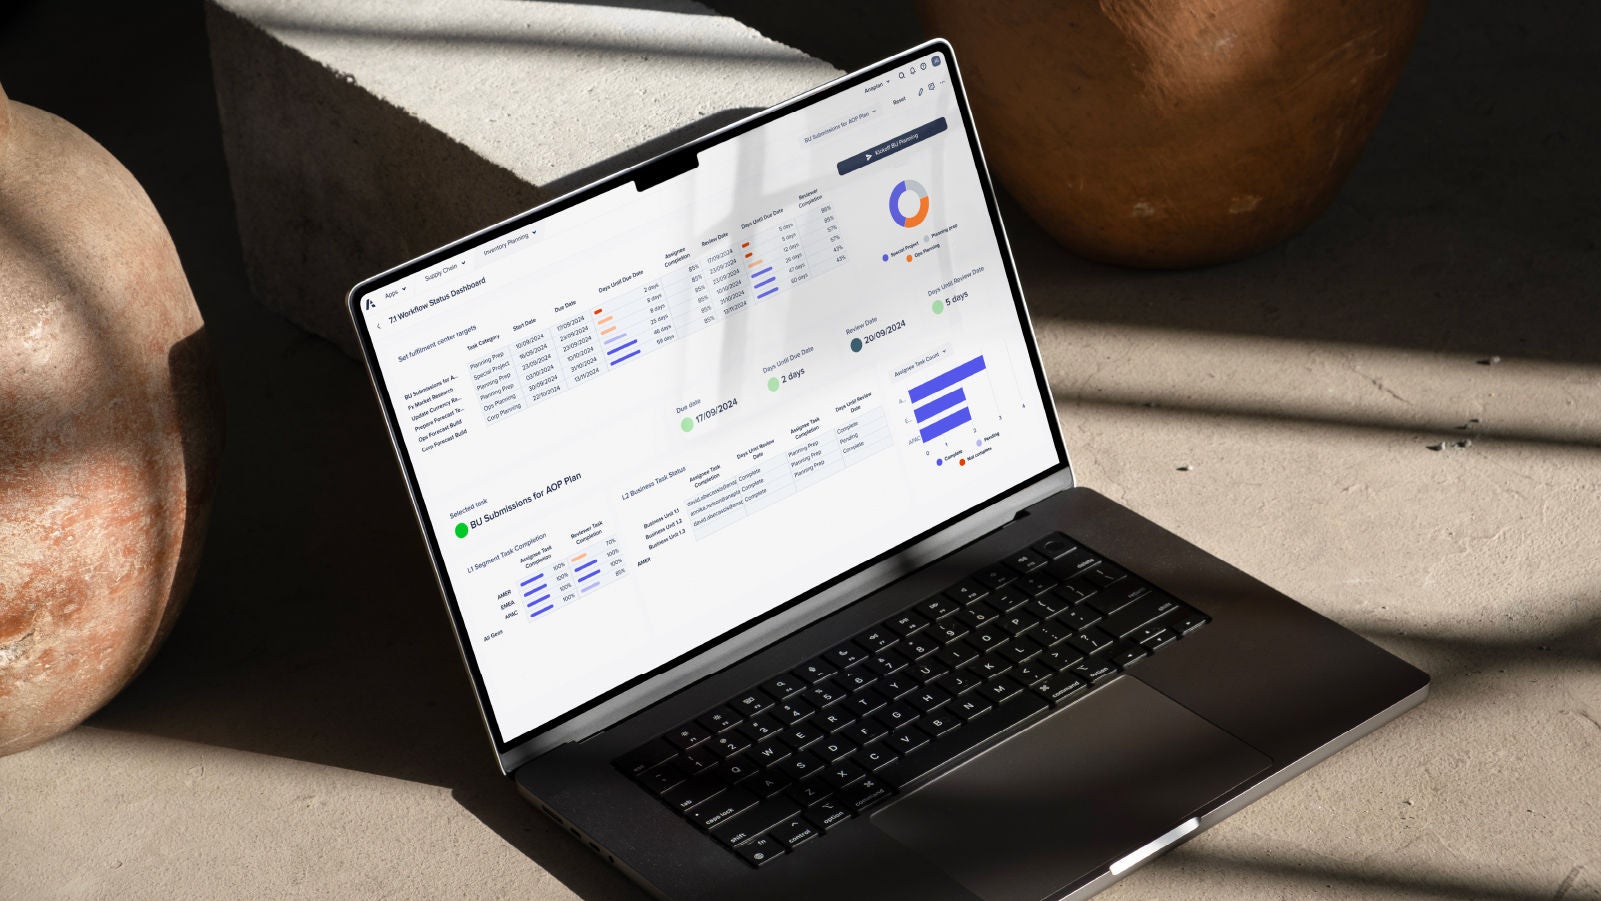
A laptop displaying a dashboard interface, positioned on a table, showcasing data and analytics.