Anaplan recognized as a Leader for the third time in IDC MarketScape for Enterprise Planning, Budgeting, and Forecasting Applications.

Management reporting and analytics
Intelligent solutions for management reporting and analytics
Streamline and automate management reporting to increase planning accuracy, monitor performance toward targets, and enhance decision-making.
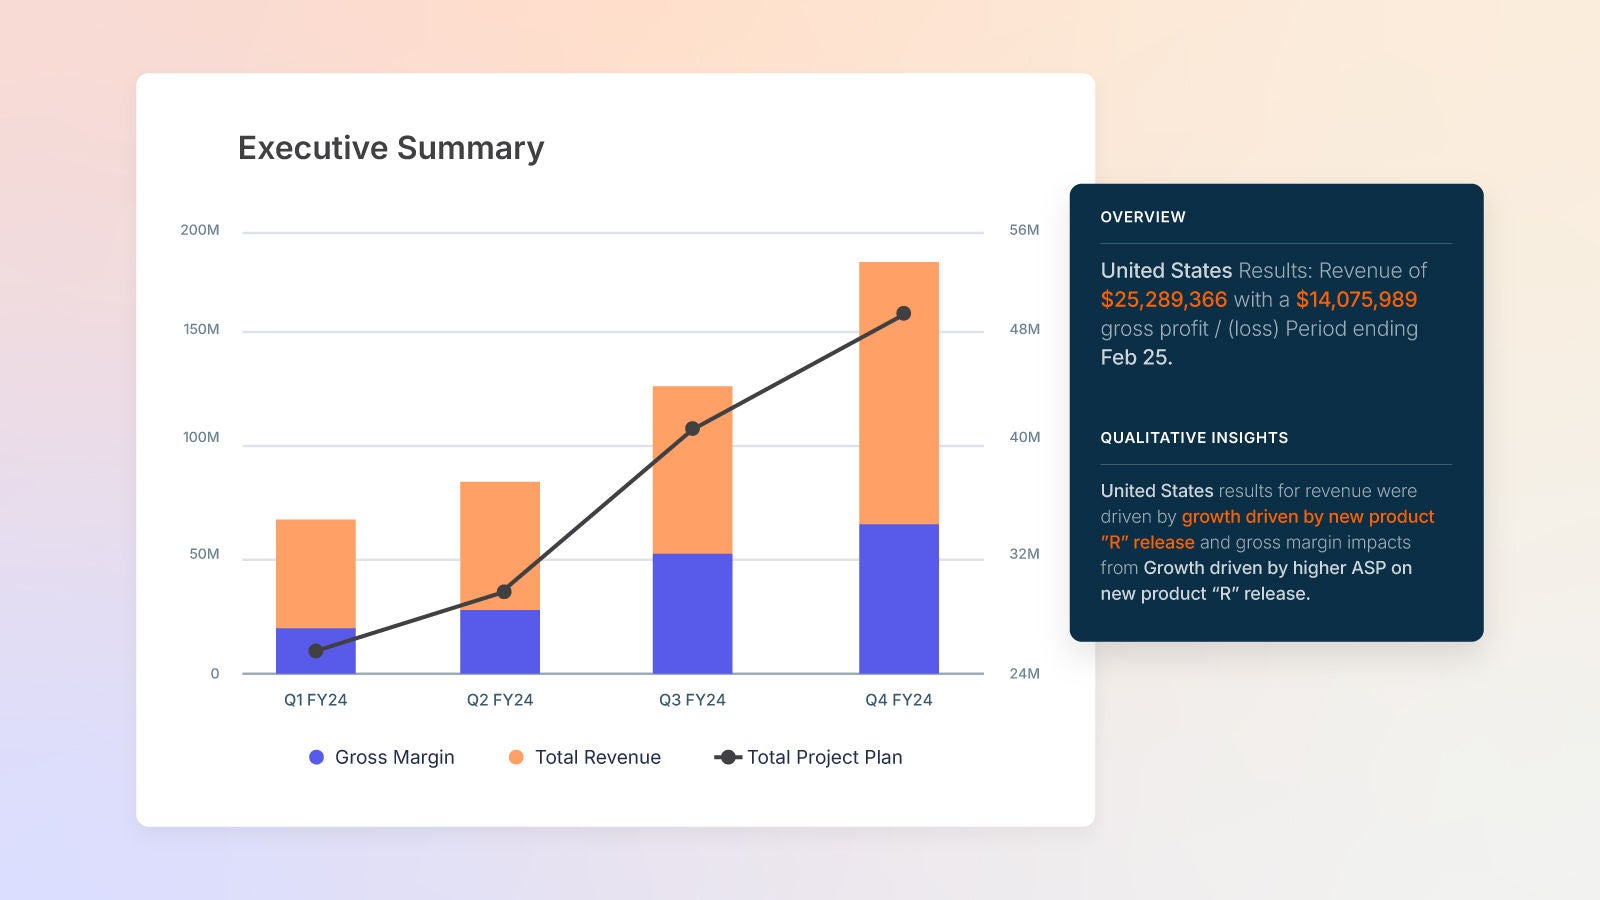
Bring clarity to every decision with real-time management reporting
Deliver fast, accurate management reports that drive smarter decisions and business agility — all without the manual work.
2025 Gartner® Magic Quadrant™ for Financial Planning Software
Anaplan named a 9X Leader in the 2025 Gartner® Magic Quadrant™ for Financial Planning Software and recognized for ability to execute and completeness of vision.

Elevate management reporting with timely, trusted insights

“We don't use PowerPoint or Excel anymore. We put it all in Anaplan and we can show it in just one slide. We can very quickly indicate what’s happening and we can answer immediately all the questions of our management with one report with 10, 15, 20 views.”
Tom Holsteens, Head of Business Controlling & BI, Brussels Airlines
Featured resources
Best practices and valuable insights to help you simplify your management reporting processes.


Discover the platform finance leaders trust.
Be the next.
Finance teams around the world rely on Anaplan to build a modern, connected enterprise. Shouldn’t you?
