Demand analytics

AI-driven solutions for demand analytics

Leverage real-time insights from disparate datasets and predictive analytics to navigate shifting demand and market signals.

An Anaplan Segmentation Analysis dashboard titled “ABC-XYZ Analysis,” showing product segmentation based on demand magnitude (ABC) and demand volatility (XYZ). The main chart, labeled “Pareto Analysis Graph – All Products,” displays blue bars representing selected data for products such as 15” Laptop, 13” Laptop, and 55” LED Television, with an orange line indicating cumulative percentage. The left panel includes editable parameters for “Periods for ABC: 52,” “Data for ABC: Selected History (R),” and “C-VAR (Min),” along with buttons labeled “Update Chart” and “Update Prior Forecast for ABC.” Below the graph, a table labeled “Current System Recommendation” categorizes products by A, B, and C classes across X, Y, and Z variability, while a bar chart on the right visualizes product counts for each category. Additional buttons on the left include “ABC-XYZ Segmentations,” “Edit & Commit ABC,” “Edit & Commit XYZ,” and “ABC/XYZ Analysis by Customer.” The interface provides structured, interactive data visualization for accessibility

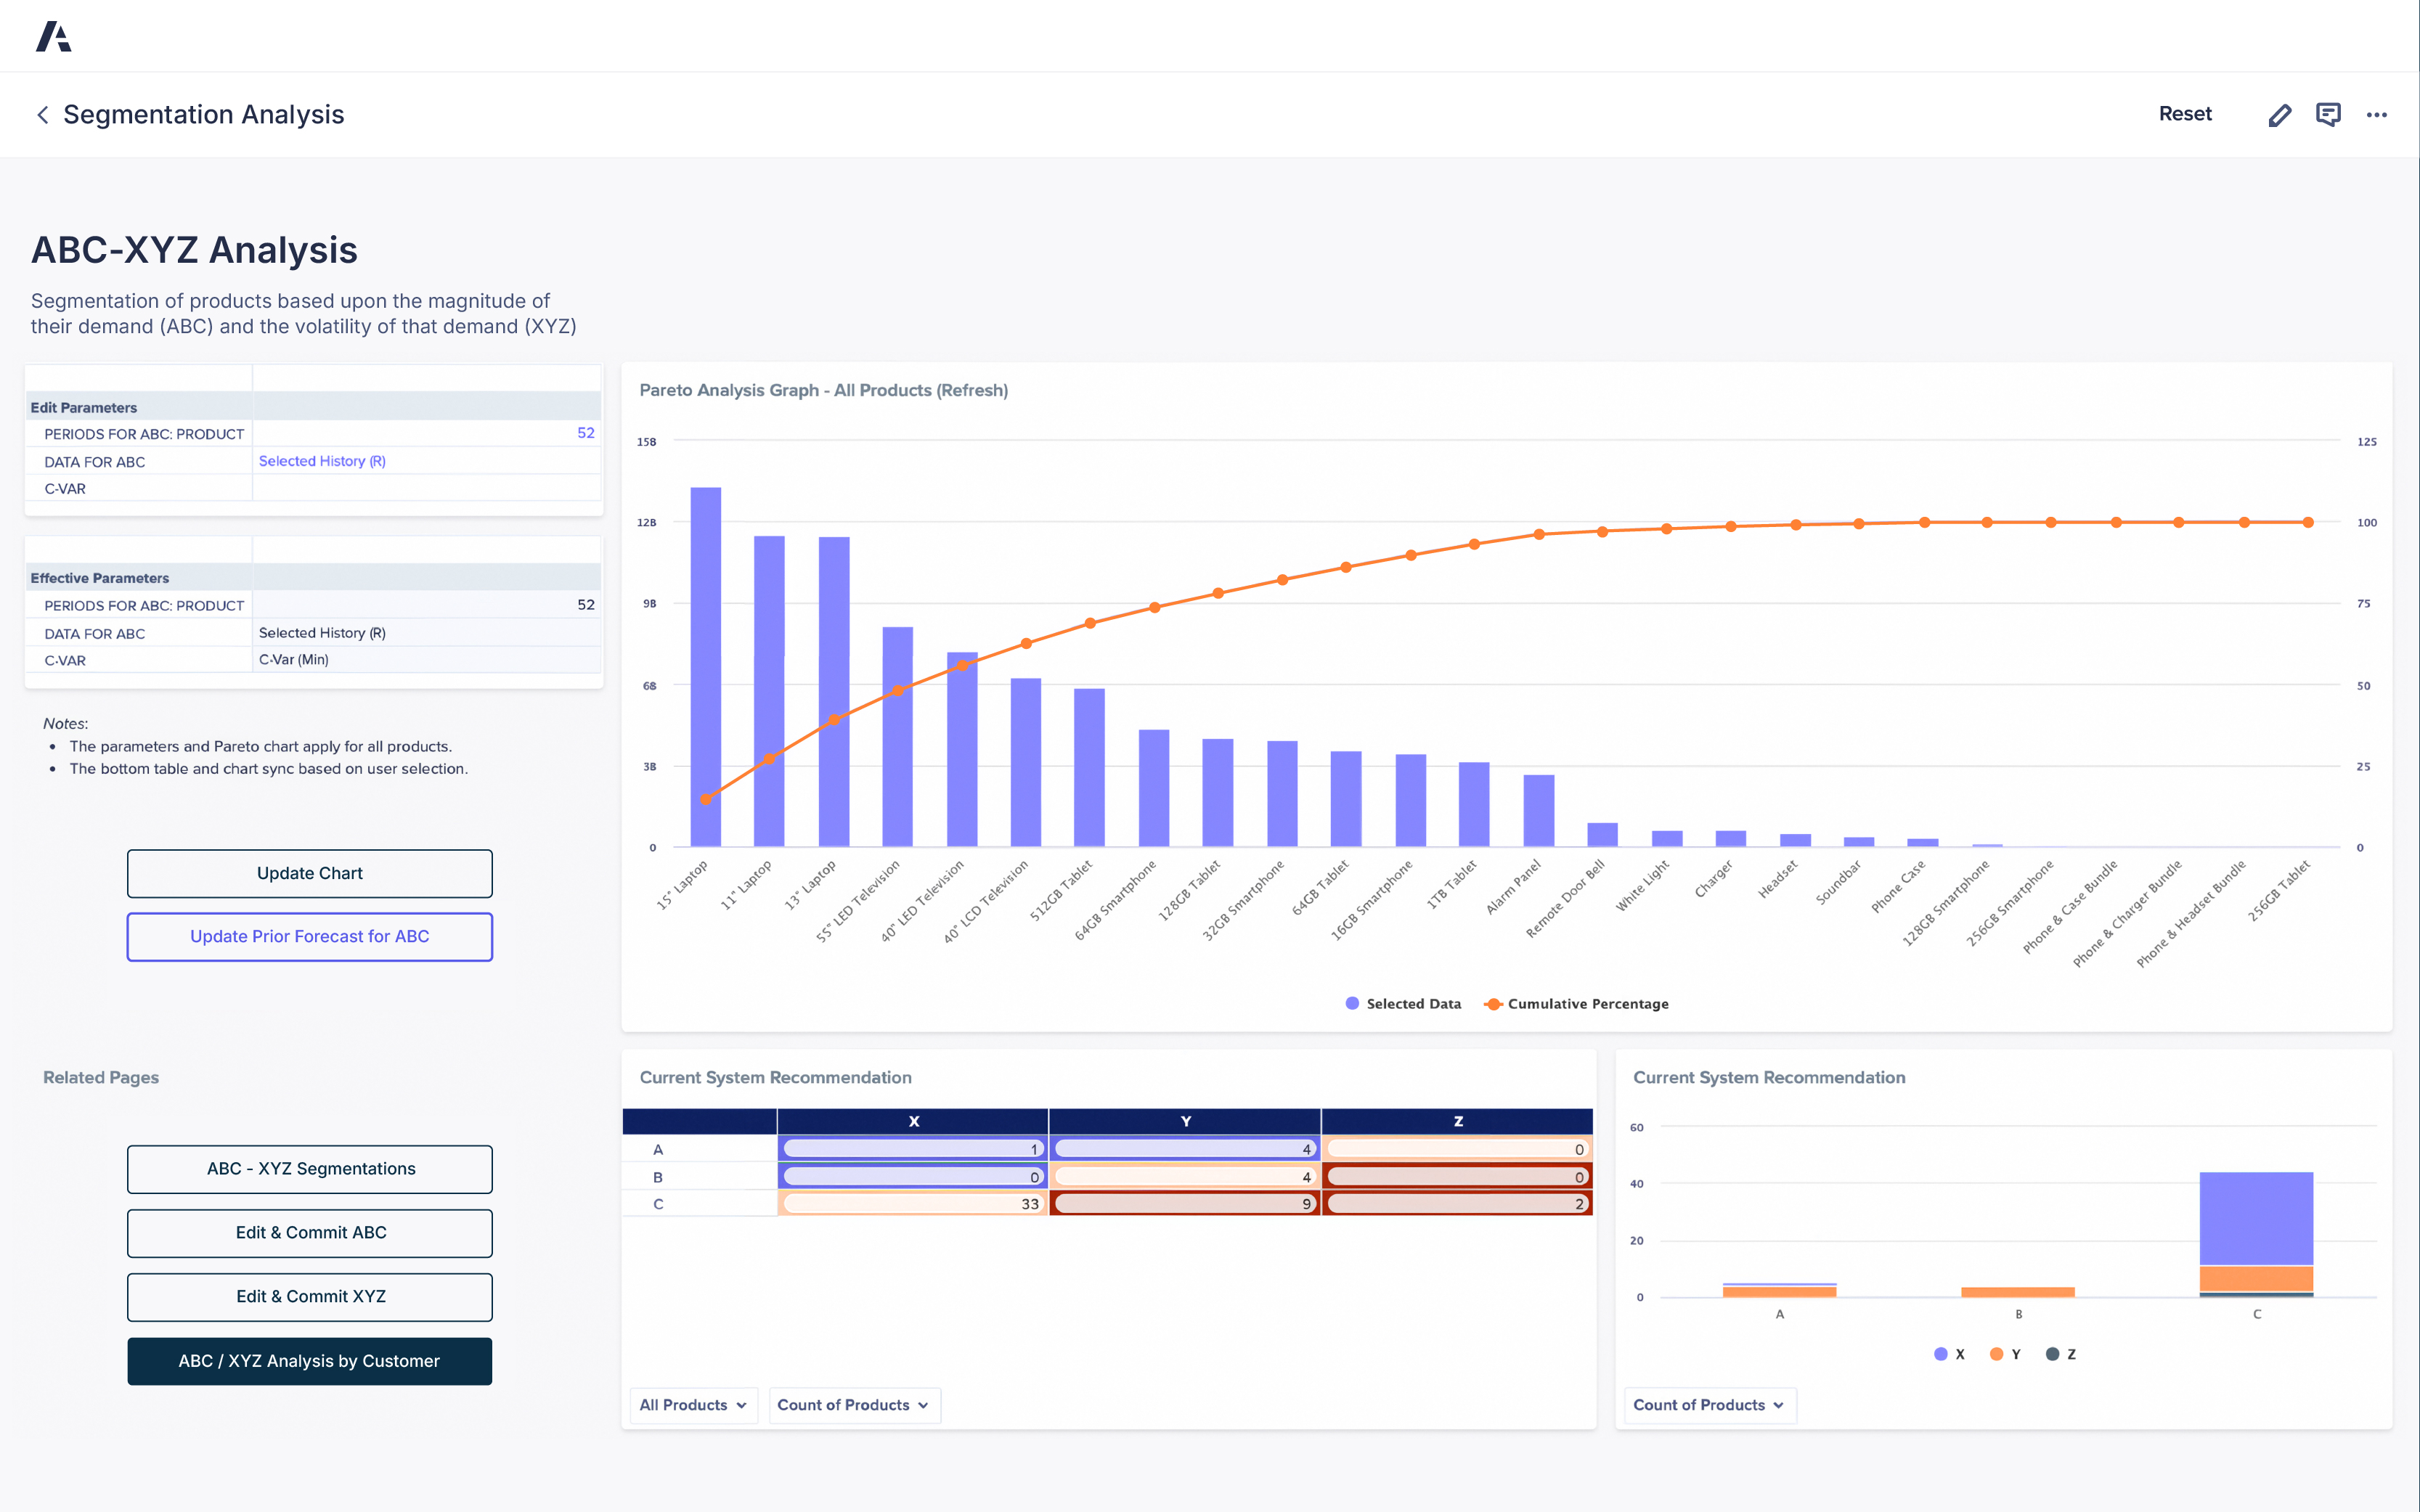
Anaplan Statistical Forecasting application

Connect across your supply chain with a purpose-built application, powered by AI and ML to deliver data-driven statistical forecasting.

Statistical Forecasting Application dashboard displaying correlation analysis with various economic indicators and a time series chart comparing forecasting methods, including Consumer Confidence Index and Baltic Dry Index impacts.

“Anaplan provides greater visibility and enables more robust demand modeling, and as a result, we are more accurate in our demand forecasting.”


Justin Moderow, Manager Integrated Business Planning and Technology, Wright Medical Technology

Wright Dark Blue Logo

Discover the platform supply chain leaders trust. Be the next.

Supply chain teams around the world rely on Anaplan to build a modern, connected enterprise. Shouldn’t you? 

A laptop displaying a dashboard interface, positioned on a table, showcasing data and analytics.