Learn why connected enterprises drive higher shareholder returns
Integrated financial statements
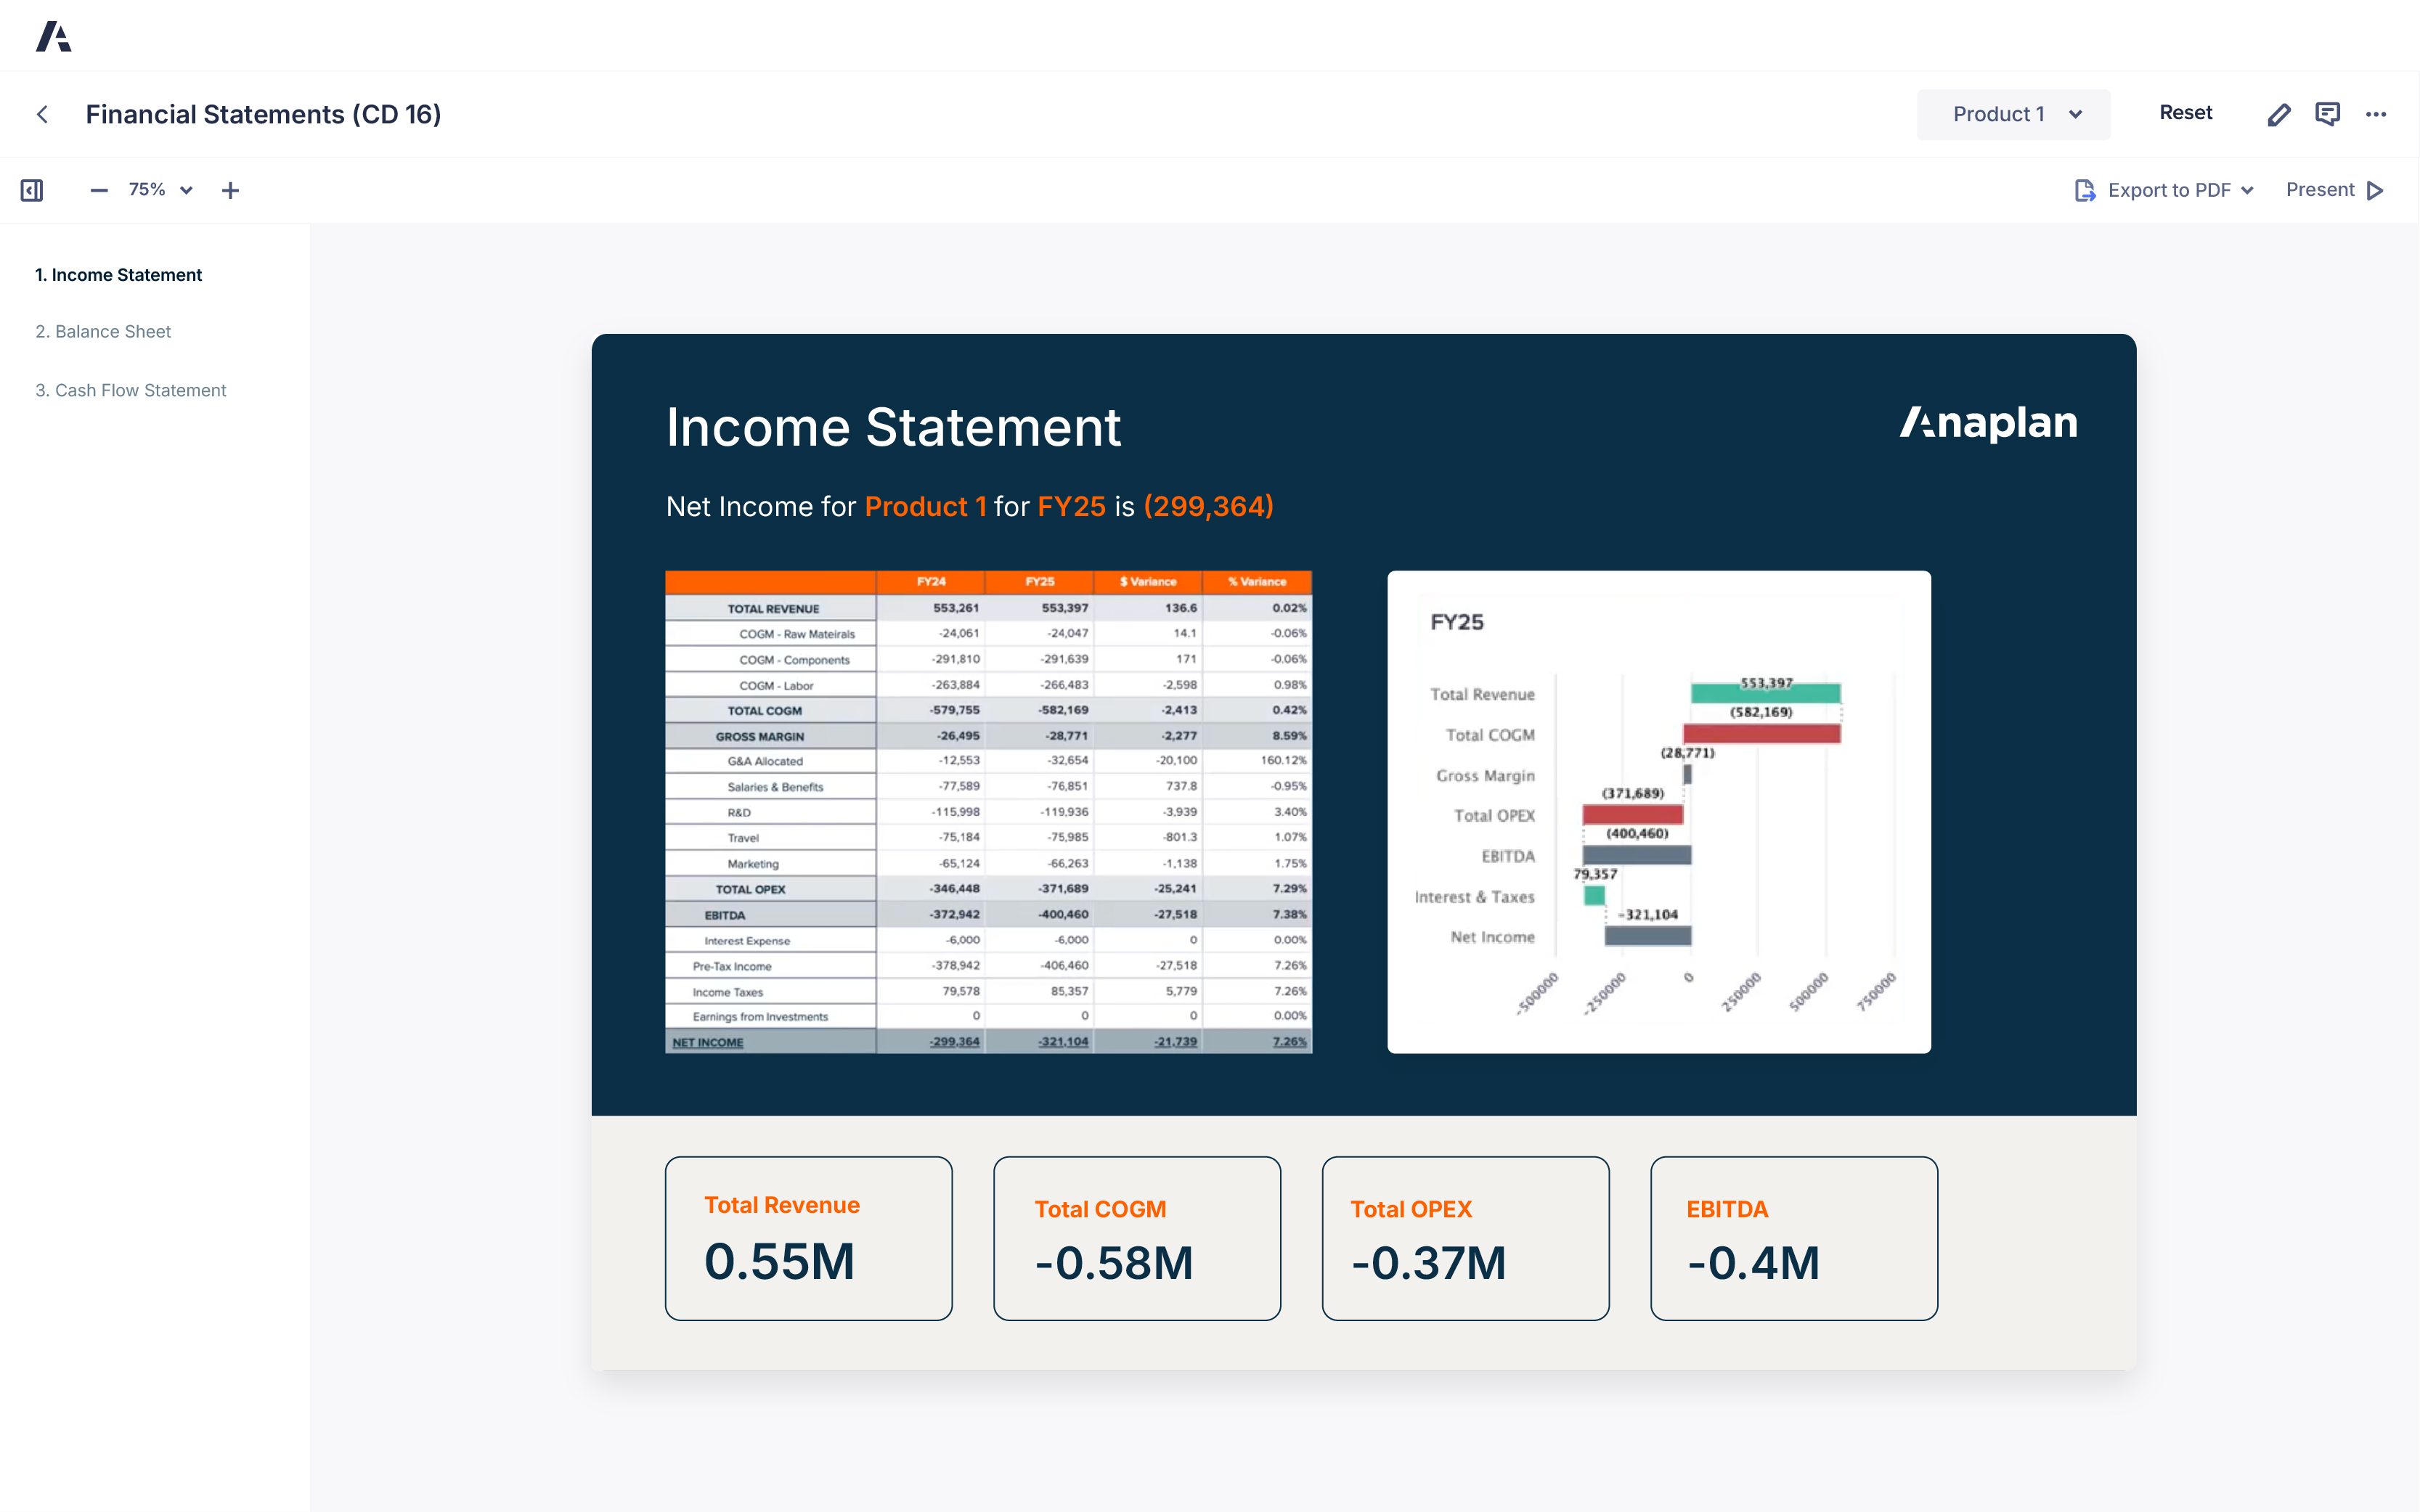
Connect your financial statements. Fuel faster insights.
Give your finance team a single, dynamic model that links income statement, balance sheet, and cash flow for a complete, integrated view of the financial health of the business.
Plan, manage, and report on every statement in one model
Replace disconnected spreadsheets with an integrated, finance-owned solution that unifies actuals and plans across the P&L, balance sheet, and cash flow — so you can course-correct quickly and guide strategy with confidence.
Anaplan Integrated Financial Planning application
The Anaplan Integrated Financial Planning application is low-code, out-of-the-box, and purpose-built for all your financial planning and analysis requirements.

Finance-first capabilities that link every statement and surface insight at the speed of business
“With Anaplan, it takes two hours to consolidate and produce reports that give top management the visibility they require.”
Darya Boldyreva, FP&A Director, AB InBev
Featured resources
Best practices and valuable insights to spark new ideas and modernize your financial statement process.


Discover the platform finance leaders trust.
Be the next.
Finance teams around the world rely on Anaplan to outpace the competition. Shouldn't you?
