Material requirements planning (MRP)

AI-driven solutions for material requirements planning

Align your planning, inventory, and procurement to power smarter production execution.
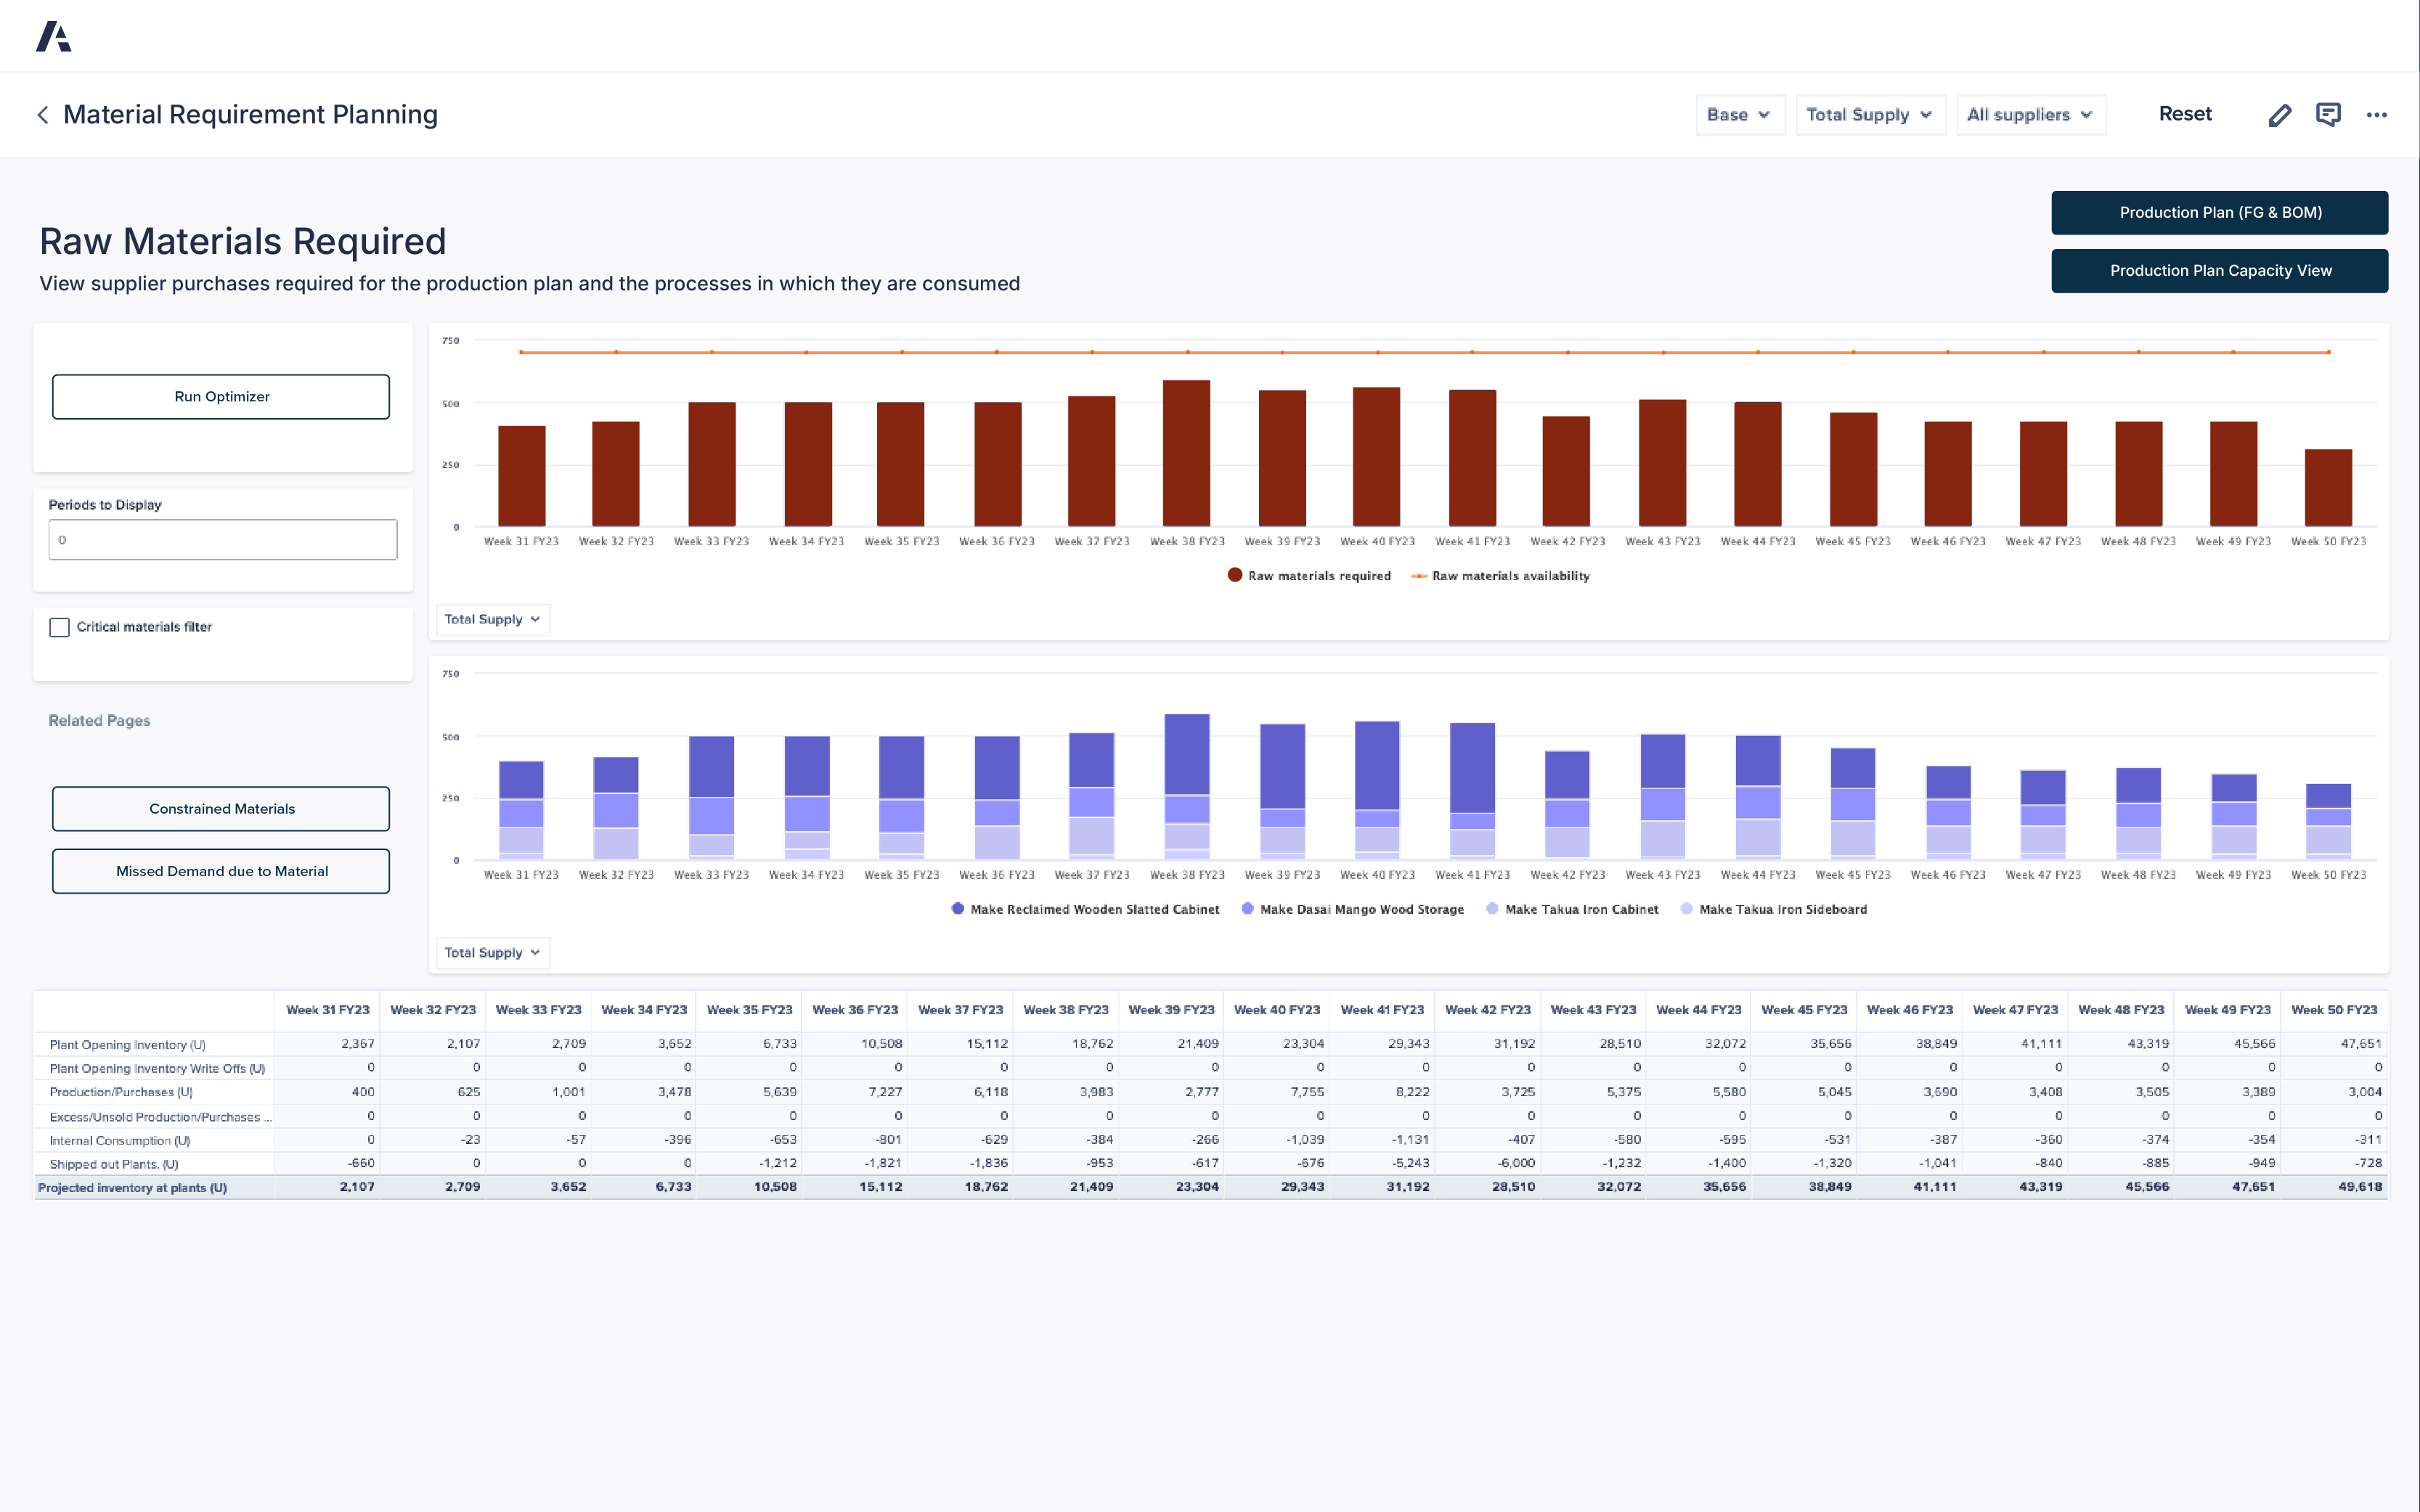
An Anaplan Material Requirement Planning dashboard displays data on raw materials required and available for production by week, titled “Raw Materials Required — View supplier purchases required for the production plan and the processes in which they are consumed.” The top section features a bar chart with brown bars representing raw materials required and an orange line showing raw materials availability across weeks 31 to 50 of FY23. Below, a blue bar chart labeled “Total Supply” visualizes production use for “Make Reclaimed Wooden Slatted Cabinet,” “Make Dasai Mango Wood Storage,” “Make Takua Iron Cabinet,” and “Make Takua Iron Sideboard.” The left panel includes buttons for “Run Optimizer,” “Constrained Materials,” and “Missed Demand due to Material.” A detailed data table at the bottom lists plant inventory and production metrics, including Plant Opening Inventory rising from 2,367 in Week 31 FY23 to 47,651 by Week 50 FY23, Production/Purchases peaking at 7,227 in Week 36 FY23, and Projected Inventory at Plants ending at 49,618 in Week 50 FY23. The interface also features dropdown filters for Base, Total Supply, and All Suppliers, providing clear labels and structured data for accessibility compliance.

Anaplan Supply Planning application

Connect across your supply chain with a purpose-built application to optimize production and capacity planning.

An Anaplan Production Planning Application dashboard showing capacity utilization and production requirements by location and process. The top section contains an organizational chart summarizing “All locations” with an average regular utilization of 75% and 4,327 underutilized periods, branching into “Reading” and “Birmingham” with utilization rates of 81% and 70% respectively. Subsections include Body Shop, Paint Shop, and Trim/Chassis Shop for each location, showing utilization percentages ranging from 52% to 100%. Below, bar and line charts display monthly production capacity data from January 2024 to August 2025. Blue bars represent total production capacity required, with darker blue and red lines indicating regular and overtime capacity limits. The lower chart compares production processes, such as “Make Discovery Exclusive Trim at Reading,” “Make Range Rover Panels,” and “Make Defender Windows.” Buttons and filters on the left include “Run Optimizer,” “Resource Capacity Required,” “Capacity Planning,” and “Missed Demand due to Resource.” The layout provides detailed, labeled data visualizations for accessible interpretation

“With Anaplan, we succeeded to make a setup with very, very rich functionality.”


Kristoffer Halle, SIOP Architect

Danfoss Dark Blue Logo

Discover the platform supply chain leaders trust. Be the next.

Supply chain teams around the world rely on Anaplan to build a modern, connected enterprise. Shouldn’t you? 

A tablet displaying the Anaplan Bottom-Up Revenue Forecasting interface. The screen shows scenario selection, forecast types, and a combined bar and line chart for monthly sales growth.