See our latest AI-driven innovations and applications.

Profitability analysis
Gain real-time visibility into cost-to-serve and returns
An intelligent profitability analysis solution for asset management firms.
Drive smarter decisions and maximize profitability
Give your finance teams the power to model with confidence, connect plans across the business, and directly optimize your cost-to-income ratio.
Discover our ready-to-deploy Profitability Analysis application
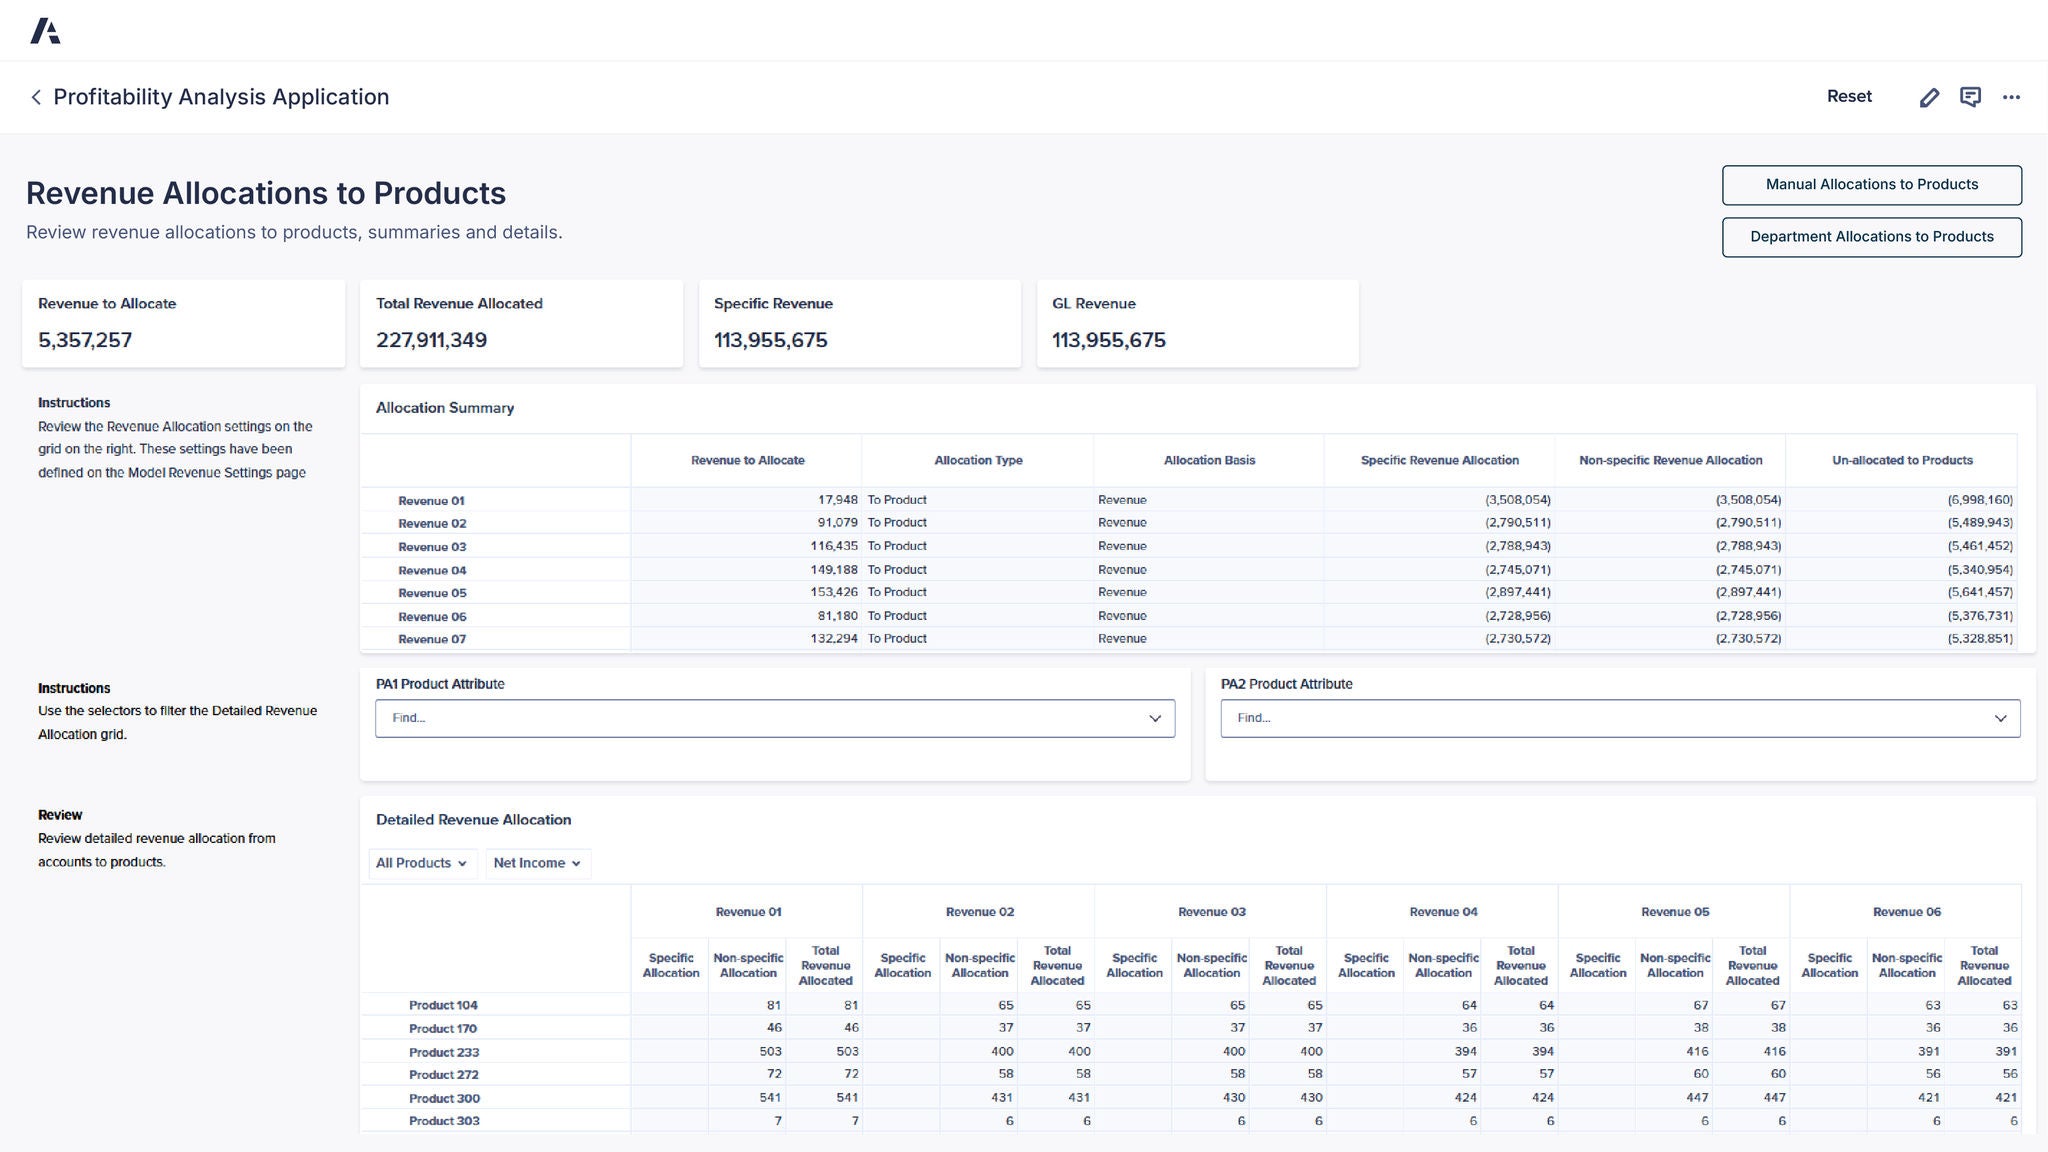
The Anaplan Profitability Analysis application provides asset management firms with an intuitive, out-of-the-box solution for real-time transparency into costs, margins, and profit drivers.

Turn real-time market changes into confident, agile responses
Optimize your profitability analysis with intelligent planning capabilities purpose-built for asset management firms.

“Previously, you'd try to give profitability views to them [the business], but they wouldn't be listening, because they didn't understand what was going on underneath the engine hood. Because we weren't able to explain it. [Now,] we're able to say, ‘these are the drivers, and if you change it from this one to that one, that's the impact.’”
Donald Macmillan, Director of Group FP&A, Aberdeen
Featured resources
Best practices and valuable insights to enhance your profitability analysis capabilities.


Discover the platform industry leaders trust.
Be the next.
Finance teams around the world rely on Anaplan to build a modern, connected enterprise. Shouldn’t you?
