Sales and operations planning (S&OP)

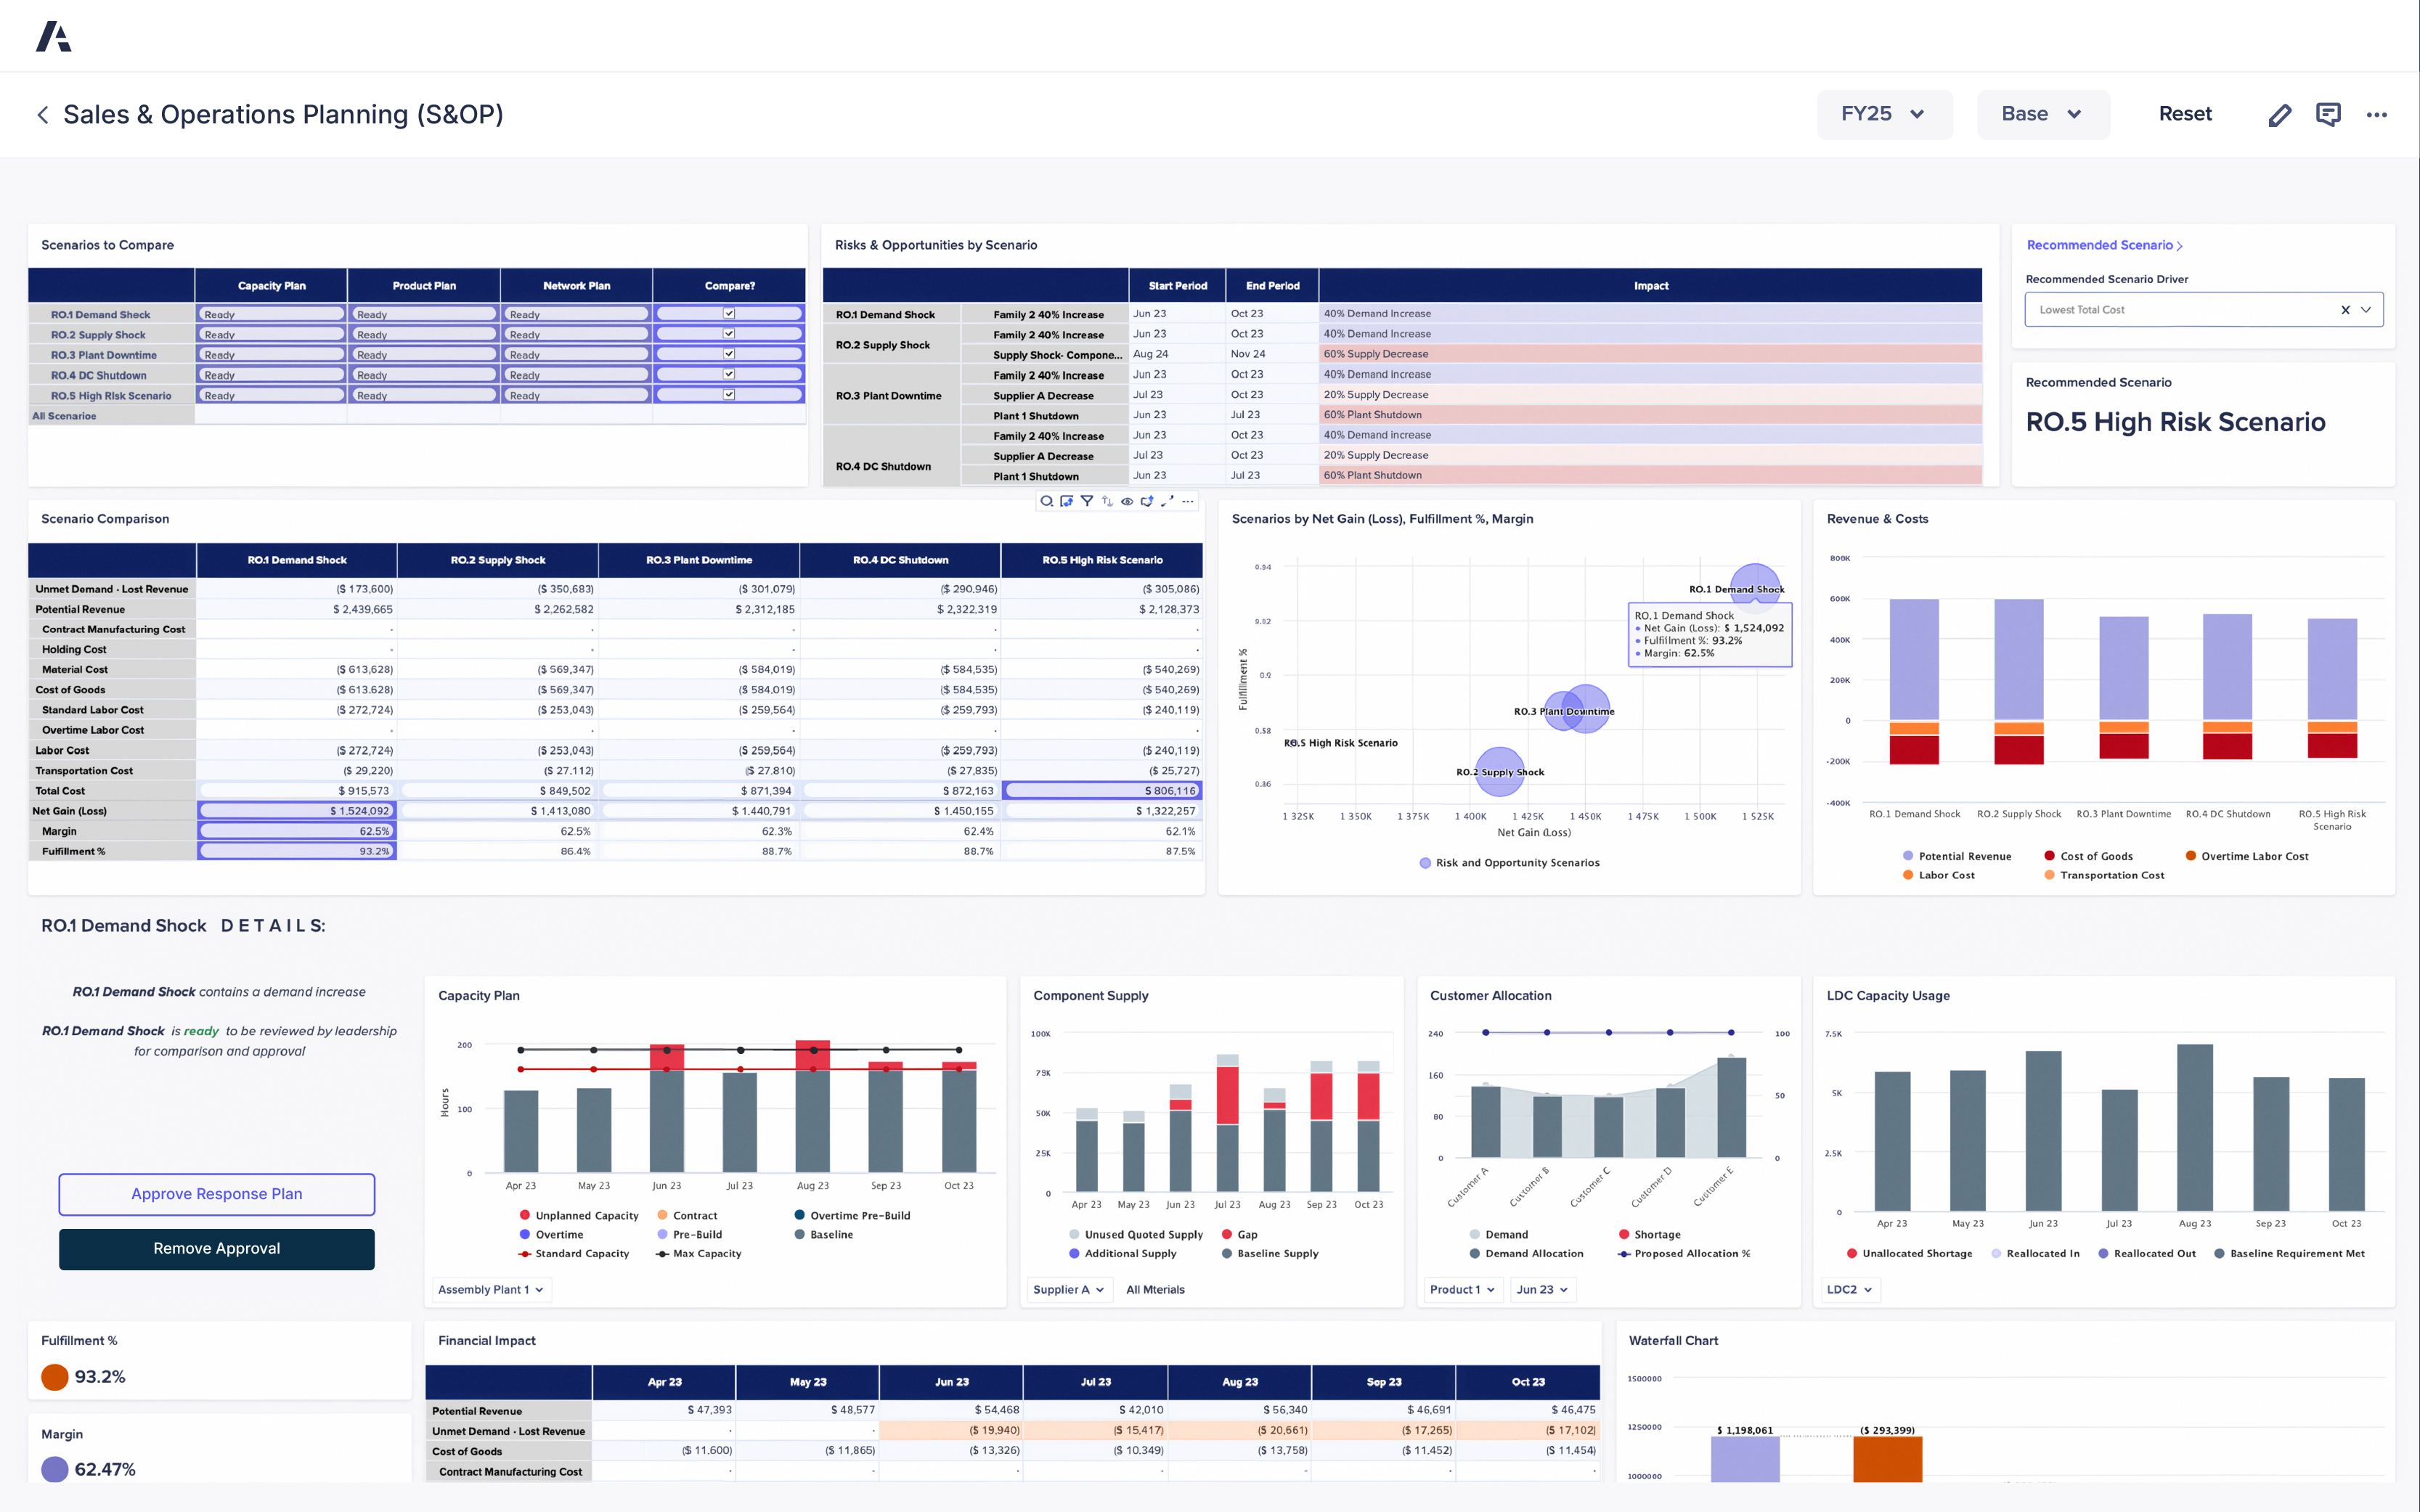
AI-driven solutions for S&OP

Make profitable decisions through intelligent scenario planning across revenue, supply, and operations.

An Anaplan dashboard titled “Sales & Operations Planning (S&OP)” showing detailed analysis for fiscal year FY25. The interface includes multiple charts and tables comparing business scenarios such as “RO.1 Demand Shock,” “RO.2 Supply Shock,” “RO.3 Plant Downtime,” “RO.4 DC Shutdown,” and “RO.5 High Risk Scenario.” The top-left table lists capacity, product, and network plan readiness, while the adjacent table highlights risks and opportunities with impact timelines and percentage changes in demand or supply. A scatter plot visualizes scenarios by net gain, fulfillment percentage, and margin, while a bar chart compares revenue and cost breakdowns, including potential revenue, labor, cost of goods, and transportation cost. The lower section contains capacity plan and component supply charts, customer allocation analysis, financial impact tables, and LDC capacity usage graphs. Metrics such as fulfillment (93.2%) and margin (62.47%) are displayed, with color-coded bars for baseline, overtime, and unallocated capacity. The page also includes approval buttons labeled “Approve Response Plan” and “Remove Approval.”

Anaplan Integrated Business Planning application

Outpace the market and your competition with a purpose-built application to drive strategic alignment and supply chain orchestration.

Anaplan integrated business planning dashboard. Displays projected revenue, cost, margin, forecast accuracy, and fulfillment metrics with visual panels for demand planning, capacity, component supply, inventory risk, and risks and opportunities.

“We have sped up decision-making about supply planning with Anaplan, helping us prevent lost sales opportunities and excess stock.”


Shinya Kushiyama, Director, Supply Chain/IT and Product Operations, Godiva Japan

Godiva Dark Blue Logo

Discover the platform supply chain leaders trust. Be the next.

Supply chain teams around the world rely on Anaplan to build a modern, connected enterprise. Shouldn’t you? 

A tablet displaying the Anaplan Bottom-Up Revenue Forecasting interface. The screen shows scenario selection, forecast types, and a combined bar and line chart for monthly sales growth.