
Planning and forecasting are challenging as our business environment faces constant uncertainties. We are experiencing slowing growth, high inflation, scarce and expensive talent, rising energy prices, geopolitical issues, labor strikes, global supply constraints. The list goes on.
These events put more pressure on you and your finance team to effectively navigate and provide insights and recommendations to help your organization achieve financial outcomes that satisfy your stakeholders. You need a solution that helps you plan through the volatility and at the speed of business.
At Anaplan, we have been disrupting the planning technology market since 2006. Our Connected and Extended Planning and Analysis (xP&A) platform has continually added more features and capabilities to help you further enrich the financial planning process, including PlanIQ, Polaris, Geo-Mapping, and Management Reporting. Let’s dive deeper into these latest finance product innovations.
PlanIQ: accurate forecasting to drive stronger outcomes
At the end of 2022, generative AI, and specifically ChatGPT, took the world by storm and catapulted artificial intelligence and machine learning (AI/ML) to the top of media attention. Tech giants have been racing to develop the next best technology to pull insights from the inordinate volumes of data captured each day from websites, social media, smart devices, companies and so forth.
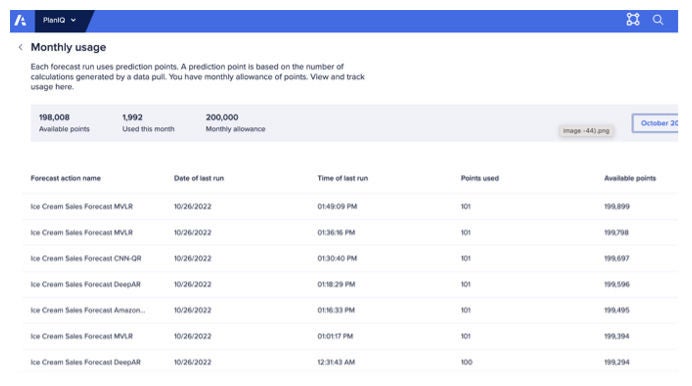
With data more accessible, businesses must respond more rapidly, with faster decision-making without sacrificing accuracy. Anaplan has been at the forefront of embedding AI and machine learning into its planning platform. In 2020, Anaplan introduced PlanIQ, which pulls data from your Anaplan models and automatically selects the best ML prediction model for the said data — saving you manual efforts and shortening your time to make decisions.
PlanIQ offers you benefits that include:
- Greater forecast accuracy – improving forecast accuracy by up to 50%, backed by ML capabilities via the industry leading Amazon, using advanced algorithms
- Simple setup and easy access – no special expertise needed to configure, deploy, and operate helping to democratize intelligent forecasting, empowering more business users to unlock new insights
- Data-backed decisions – scale intelligent forecasting across use cases and datasets and automated seasonality decomposition and trend analysis enabling data-driven growth for your entire business
- Increase efficiency – no dependence on external teams (i.e., data science, IT) helps improve planning efficiency in extracting insights from large volumes of data
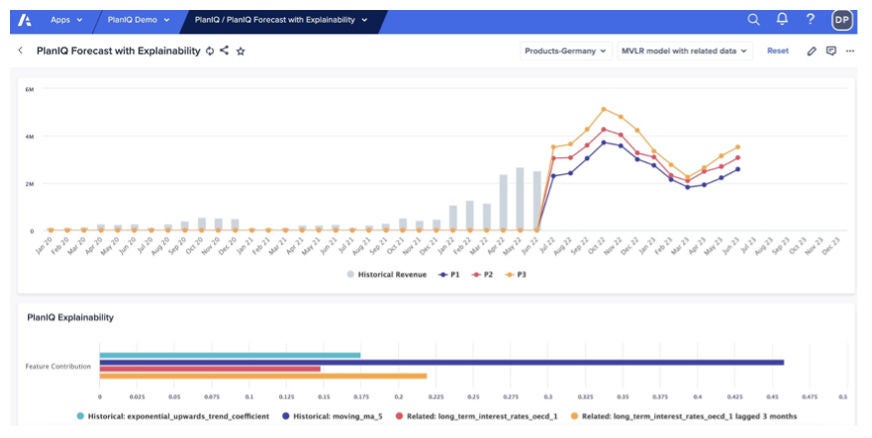
- Explainability – clearly see factors (i.e., internal/external data, historical seasonality) that drive the forecast model to focus your time on business partnering and decision-making
How PlanIQ helps you
Quickly identifying the reasons behind your past performance offers better guidance on how to forecast your future performance. PlanIQ can show you the key drivers behind the variances. For example, your revenue increase could be attributed to a new product introduction, a market expansion, or a price increase in connection with higher inflation rates.
PlanIQ can also indicate influences on COGS and operating expenses from higher R&D spending related to a new product planned, lower lease expenses tied to a weaker real estate market, or higher salaries reflecting more skilled talent hiring. It can forecast your cash flow based on trends of your working capital and expected capital spending and dividend payments. Depending on internal and external data and intelligence that it has access to, PlanIQ can essentially forecast your top- and bottom-line.
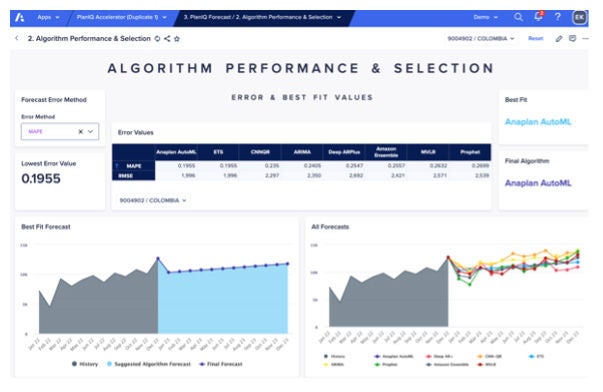
PlanIQ’s sophistication goes beyond the traditional forecasting methods of moving averages and simple algorithms that require deeper statistical skills — and yet you don’t need potentially costly third-party AI/ML data science teams. The forecasting capabilities of PlanIQ reside in the perfect intersection of AI/ML technology and the Anaplan platform to make forecasting easy for you.
PlanIQ brings us a number of advantages within the Anaplan platform. Most notably, its seamless integration with the platform lets us leverage different levels of information and data, improving our overall data quality and also helping us hone the forecasting.
Polaris: granularity modeling powers greater insights
Designed as a calculation engine that stores and calculates models with sparse data sets, Anaplan Polaris allows you to model with greater dimensionality and granularity. How detailed you plan your business depends on the structure and complexity of your organization and your business needs, but planning at the most granular level possible is crucial to achieving the greatest accuracy and flexibility.
Polaris provides you benefits that include:
- Sparse datasets – natively store and calculate highly sparse (empty or zero-value) datasets empowering you to model and analyze your businesses at the natural dimensionality and granularity
- Fast insights – drive business outcomes faster with actionable insights from slicing and dicing through every facet of your business and modify your what-if scenarios with more precision
- Democratizing technology – empower your business users to generate insight and analyses in real-time to respond to market volatility more rapidly
What value Polaris offers you
In finance, the ability to slice and dice data across multiple levels and dimensions of your business at will for transparency into the business could turbocharge various business decisions. For instance, you may want to see, plan or forecast and make decisions on revenue by geographic region, country, state, city, territory, sales rep, product family, product line, or SKU.
You may also want to plan OpEx from the top down to the cost center to the personnel level and CapEx from consolidated total down to the city or zip code level and by the type of capital expenditures like property, equipment, land, computers, furniture, and software.
Planning to the granularity and dimensionality of your business offers a comprehensive view of your business and enables you to respond to market challenges faster. You can work with your data in its native form thus reducing dependence on third-party tools and lowering your total cost of ownership (TCO).
With Polaris, we can 'plug and plan' FP&A modeling across multiple areas within our organization.
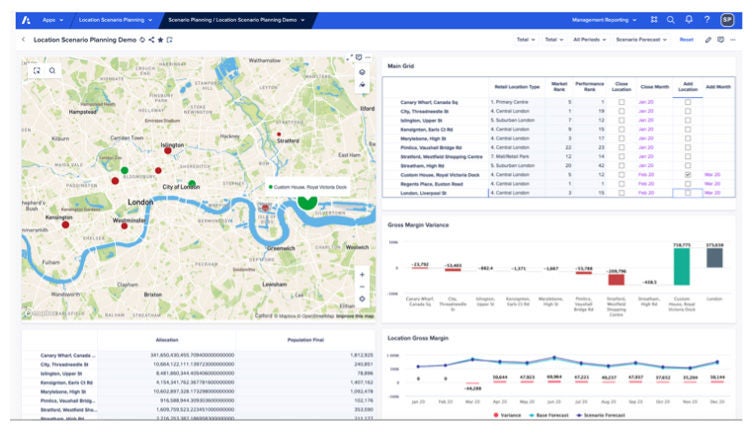
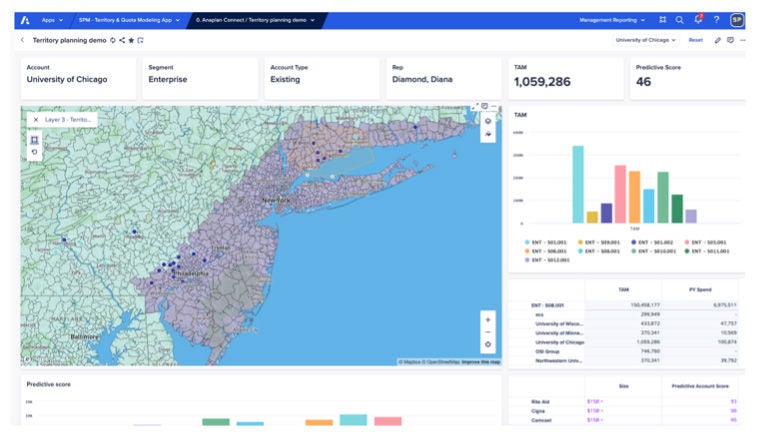
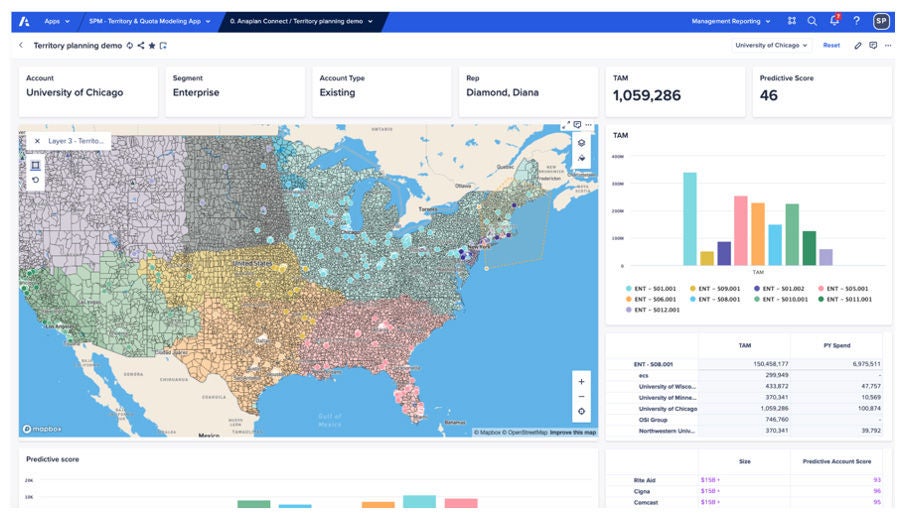
Geo-Mapping: data mapping to storytelling in a snap
MIT found that 90% of information transmitted to the brain is visual. And according to Bain & Company, companies that use data visualization are five times more likely to make faster decisions and three times more likely to execute
To help better visualize your data, Anaplan’s geo-mapping allows you to map data from a global view all the way down to zip codes. Business users will find the mapping capabilities intuitive and easy to use. You have the flexibility to adjust the map in real time to see results instantly when doing modeling, scenario planning, and what-if analysis.
Geo-mapping gives you benefits including:
- Dynamic data visualization – visualize and interact with data in new ways enabling you to detect patterns and trends that may have been hidden in traditional data formats
- Data-driven graphics – customize your maps by adding markers to the size and color based on your model data to clearly see insights
- Real-time view – see your data changes reflected on the map immediately and see the impact eliminating the need to push data to an external mapping tool
What value geo-mapping offers you
Imagine showing leadership a vibrant map of your sales data by geographic regions and then drilling it down to country, to region, to city and so on while you narrate over the global sales performance. Similarly, seeing how nicely aligned
your personnel are physically with your expansion plans provides you confidence in delivering on your corporate objectives.
You can visualize financial data as well as operational data like headcount locations, sales territories, supply chain networks, inventory management — the possibility is endless. Map your data dynamically and vividly, instead of tables filled with numbers, for a more compelling story to get buy-in from executives and the board.
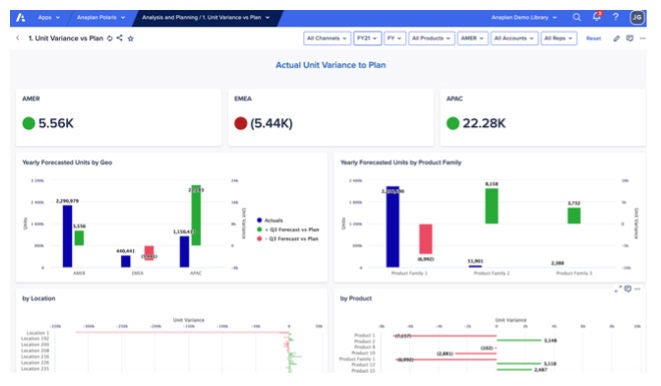
Management Reporting: visualize insights and recommendations to compel action
Pictures speak louder than words (or numbers). Taking your data to insights and presenting those to leadership compellingly is critical to transform your hard work of gathering and analyzing data to actionable, insight-filled recommendations to executive leadership that propel your company forward.
Anaplan Management Reporting offers you benefits including:
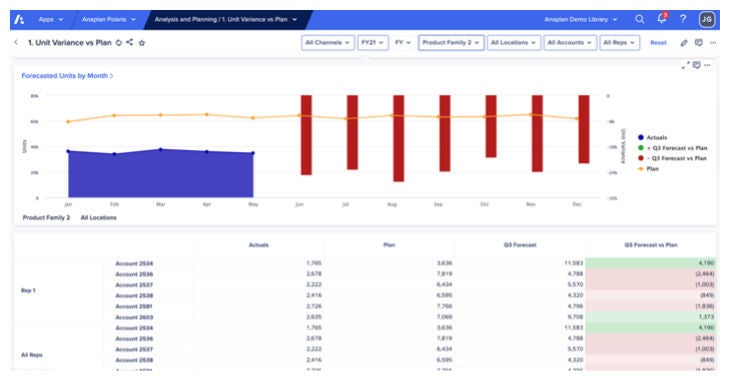
- Variance reporting – easily calculate on-the-fly to quickly make and execute plans that align with business goals and objectives without assistance from a model builder
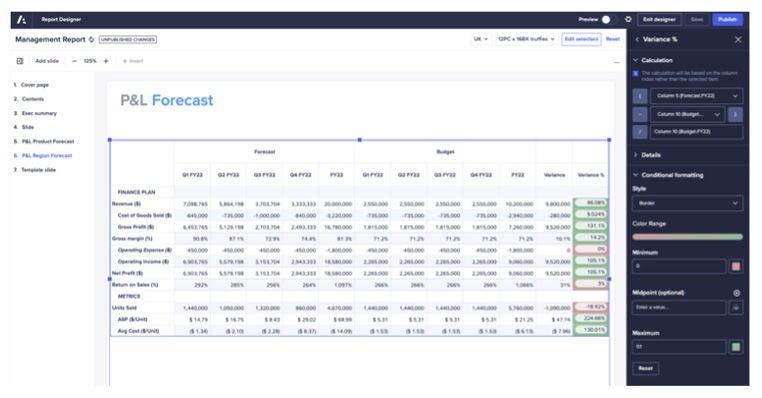
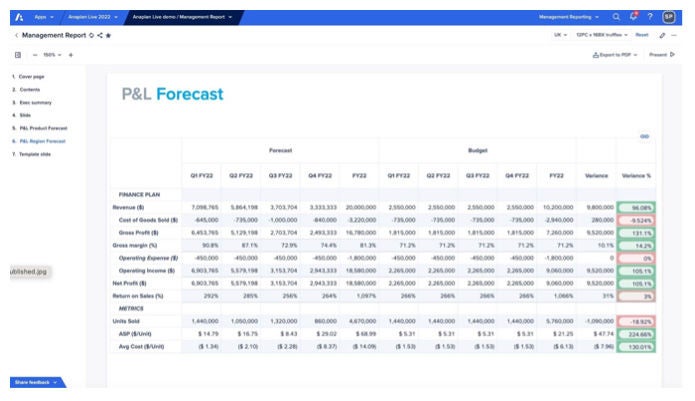
- Report page – bring executive and management reports to life with clear, impactful visuals and present your report live in presentation mode
- Sharing & distribution – get insights to stakeholders quickly using preview and PDF export options and email report pages, boards, and worksheets to colleagues using sharing option
- Report styling – highlight key data and trends with more report flexibility and enhanced formatting
What values Management Reporting offers you:
- Report at the speed of business – quickly turn around pre-built, stylish reports for presentations with real-time data updates
- Convey clearly and effectively – bring data narratives to life with rich, dynamic text cards and break up lengthy reports into easily digestible slides for greater focus giving you more confidence in presenting
- Tailor the right reports – create attractive presentation-ready reports appropriate for board, executives, management to easily digest, discuss, and align on action
With Management Reporting, we will implement standard presentations and exportable slides that will save an estimated one hour, per report, per person, per month. We can build a compelling report once, easily standardize that template, and then present it many times without spending days on new formatting and design.
See, plan and lead with Anaplan
To help achieve your financial targets, Anaplan is committed to continually enhancing platform features and capabilities. Anaplan pioneered Connected Planning, and it has gained market acceptance over the years. Recognizing the criticality of connecting planning across the enterprise, Anaplan has always pushed the boundaries of planning as we understand your need to break down data and decision silos across business units and functions to drive fast, informed decision-making. Anaplan is the only cloud-native platform able to deliver on the promise of Connected Planning on a single platform as validated by leading analyst firms.