Sales forecasting

AI-driven solutions for sales forecasting

Unify data, sharpen visibility, and act fast — so you can say “yes” to smarter decisions and stronger performance.
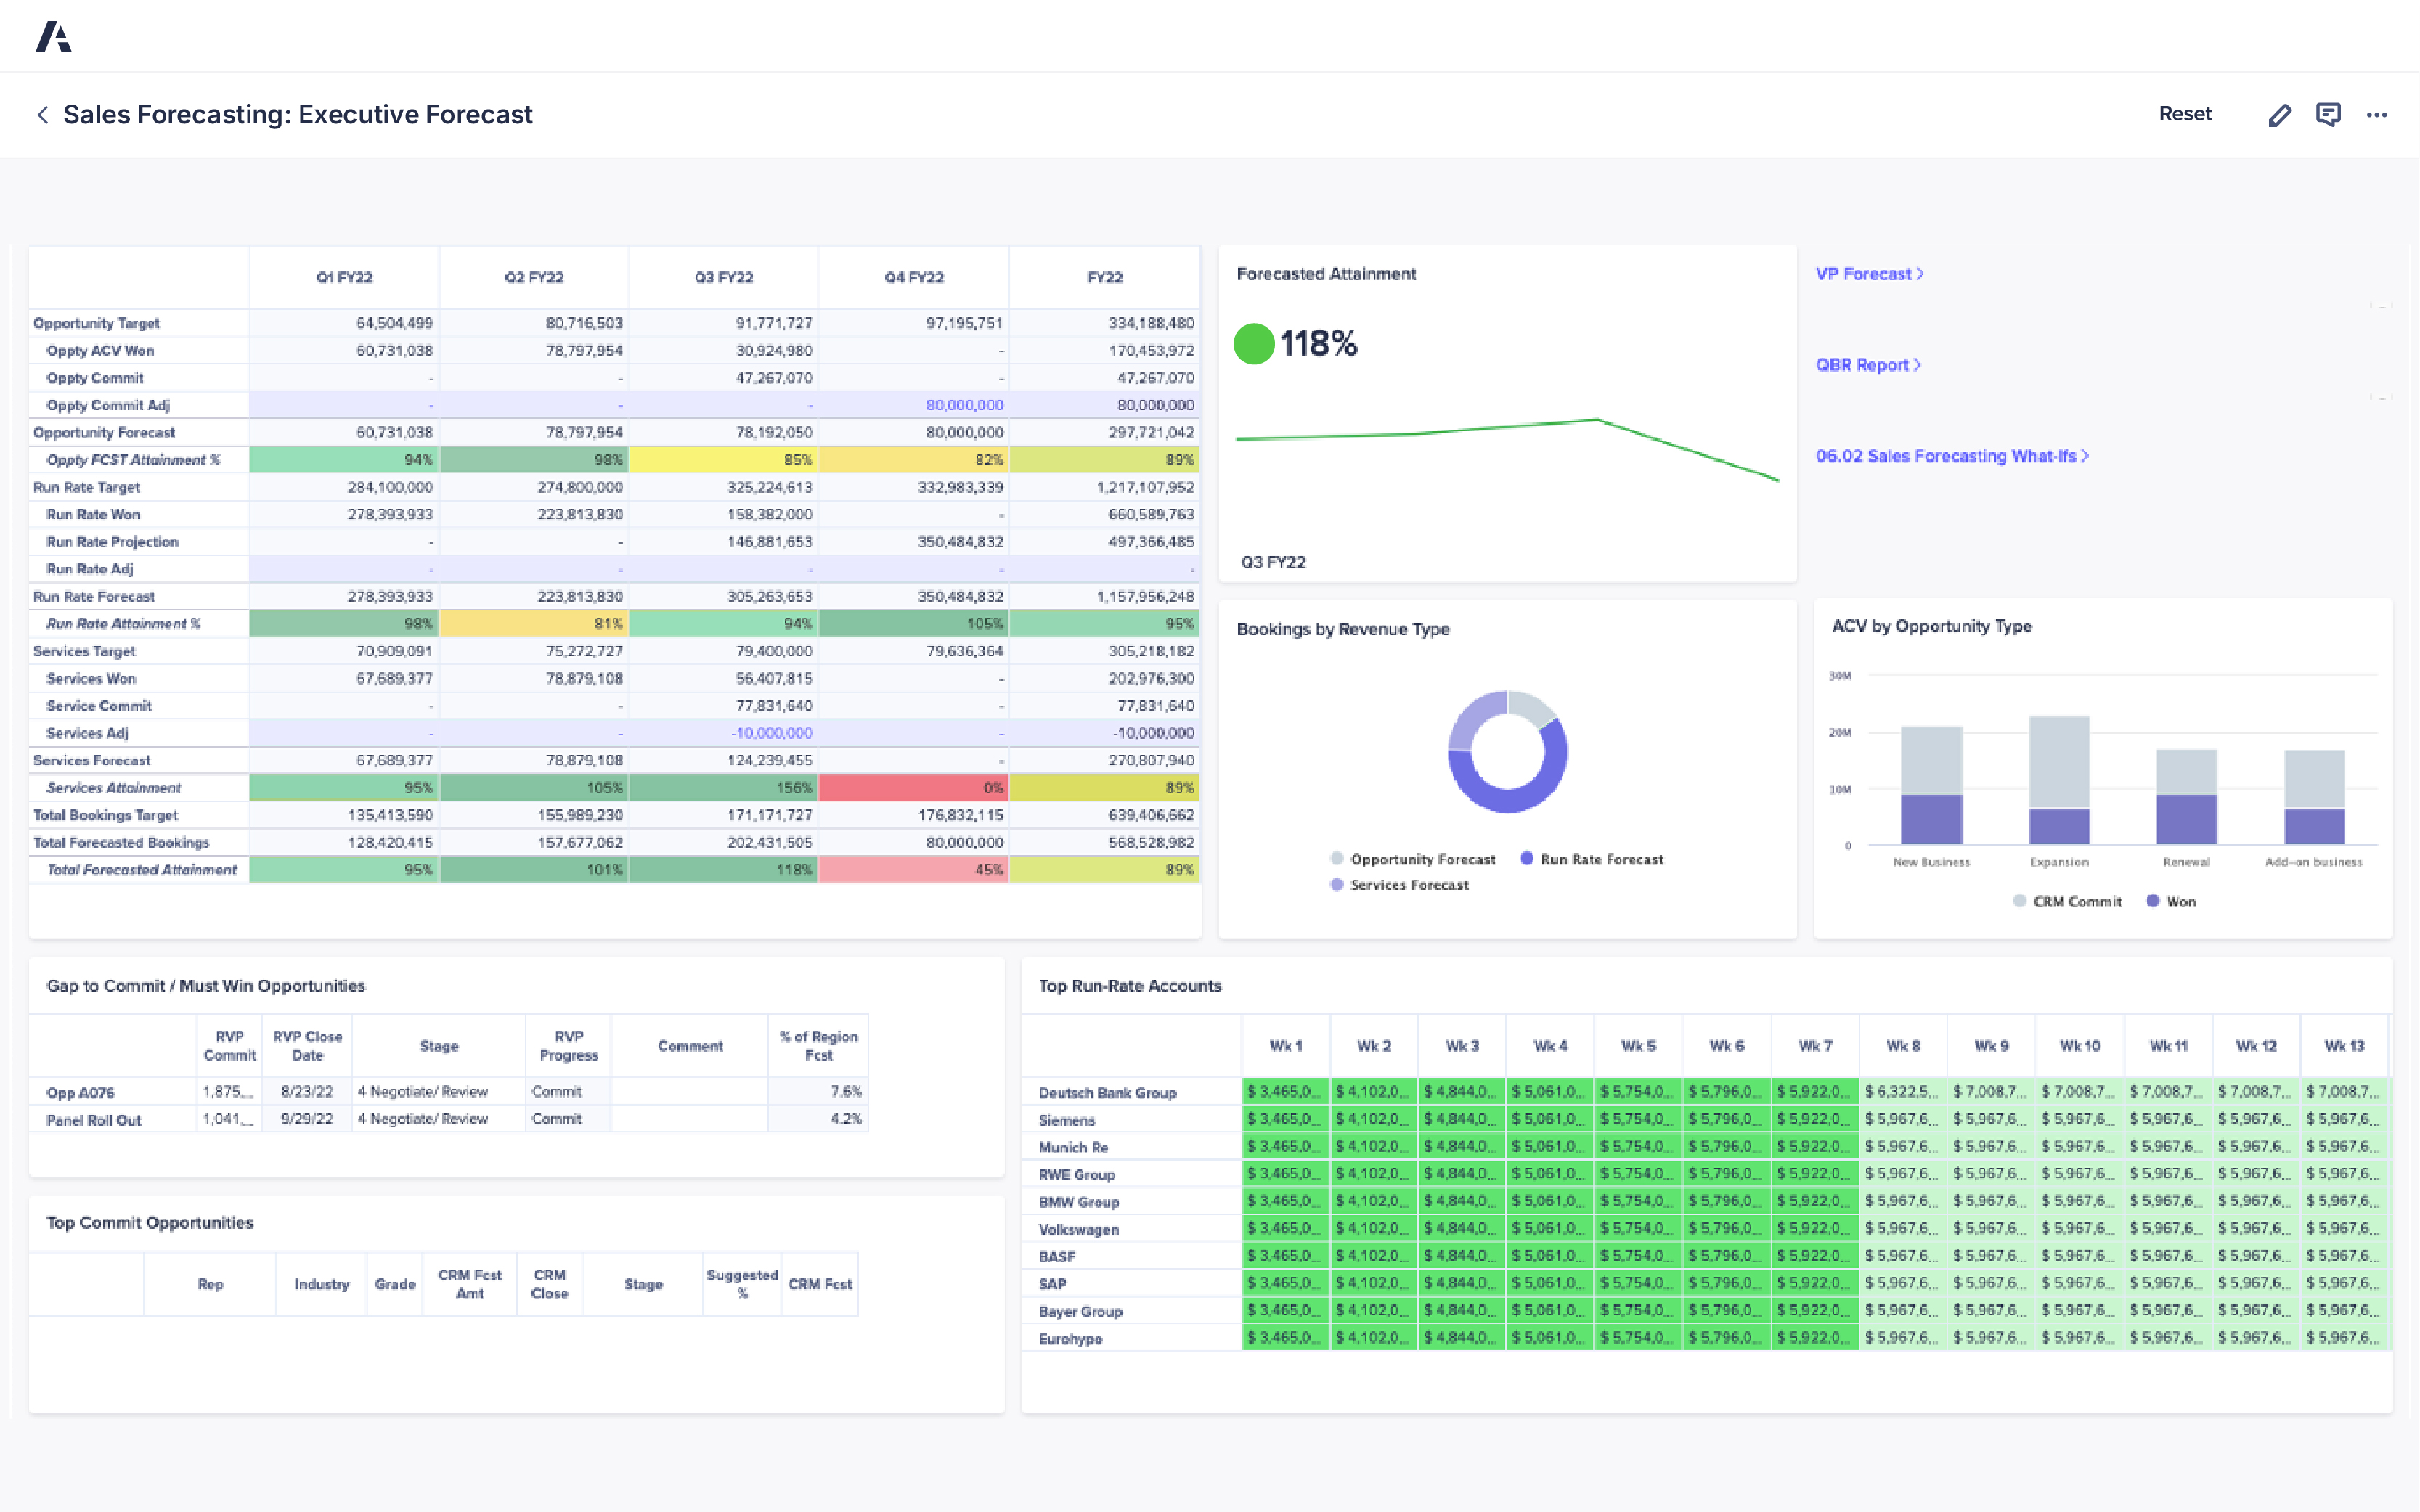
Dashboard titled Sales Forecasting: Executive Forecast. Central table shows quarterly data: Opportunity Target Q1 FY22: 64,504,699, Q2: 90,771,038, Q3: 91,747,262, Q4: 97,196,751, FY22: 234,188,802. Opportunity ACV Won Q1: 60,701,038, Q2: 90,820,984, Q3: 117,497,508, Q4: 47,067,870, FY22: 170,455,327. Forecasted Attainment shows 118% with green upward line graph. Right side donut chart Bookings by Revenue Type shows Opportunity Forecast, Run Rate Forecast, and Services Forecast. Bar chart ACV by Opportunity Type compares CRM Commit and Won across New Business, Expansion, Renewal, and Add-on business. Bottom tables include Gap to Commit / Must Win Opportunities with opportunities like App A076 and Panel Roll Out, showing commit amounts, close dates, stages, and % of Region For. Top Run-Rate Accounts lists Deutsche Bank Group, Siemens, Munich Re, RWE Group, BMW Group, Volkswagen, BASF, SAP, Bayer Group, and Eurohypo with weekly values displayed in green cells across 13 weeks.

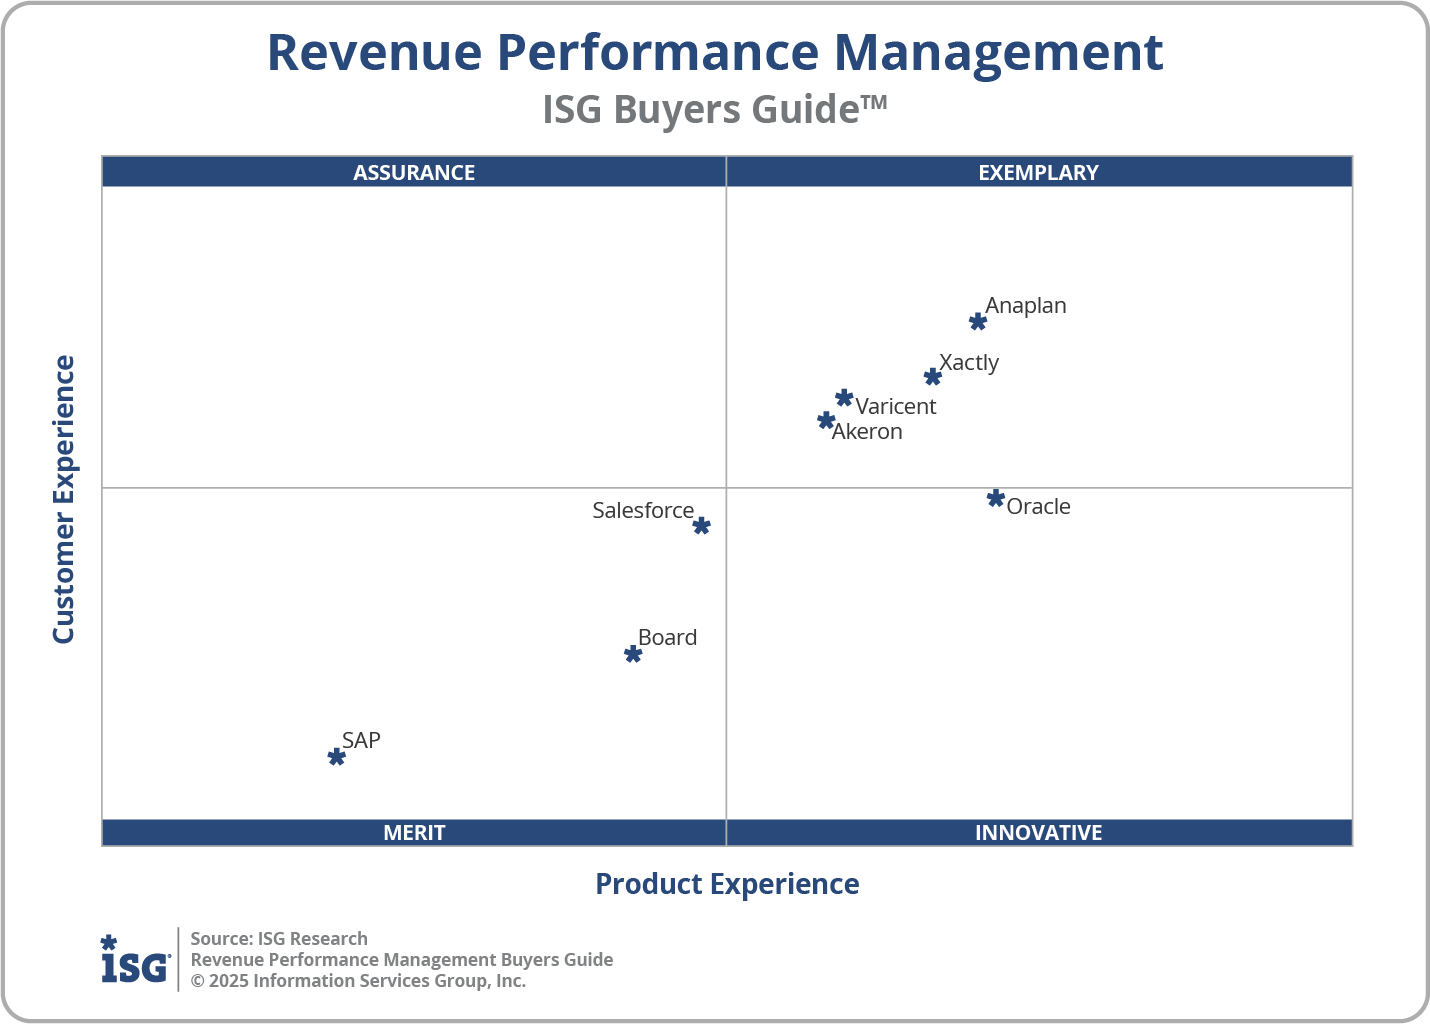
2024 ISG Research Revenue Performance Management Buyers Guide

Learn how Anaplan enables organizations to “adjust territories, quotas, and incentives based on data-driven insights and forecasts rather than a whim and gut feeling.

Quadrant chart titled Revenue Performance Management – ISG Buyers Guide. The x-axis is labeled Product Experience (Merit to Innovative) and the y-axis is labeled Customer Experience (Assurance to Exemplary).

Discover the platform sales leaders trust.
Be the next.

Revenue and sales ops teams around the world rely on Anaplan to outpace the competition. Shouldn't you? 
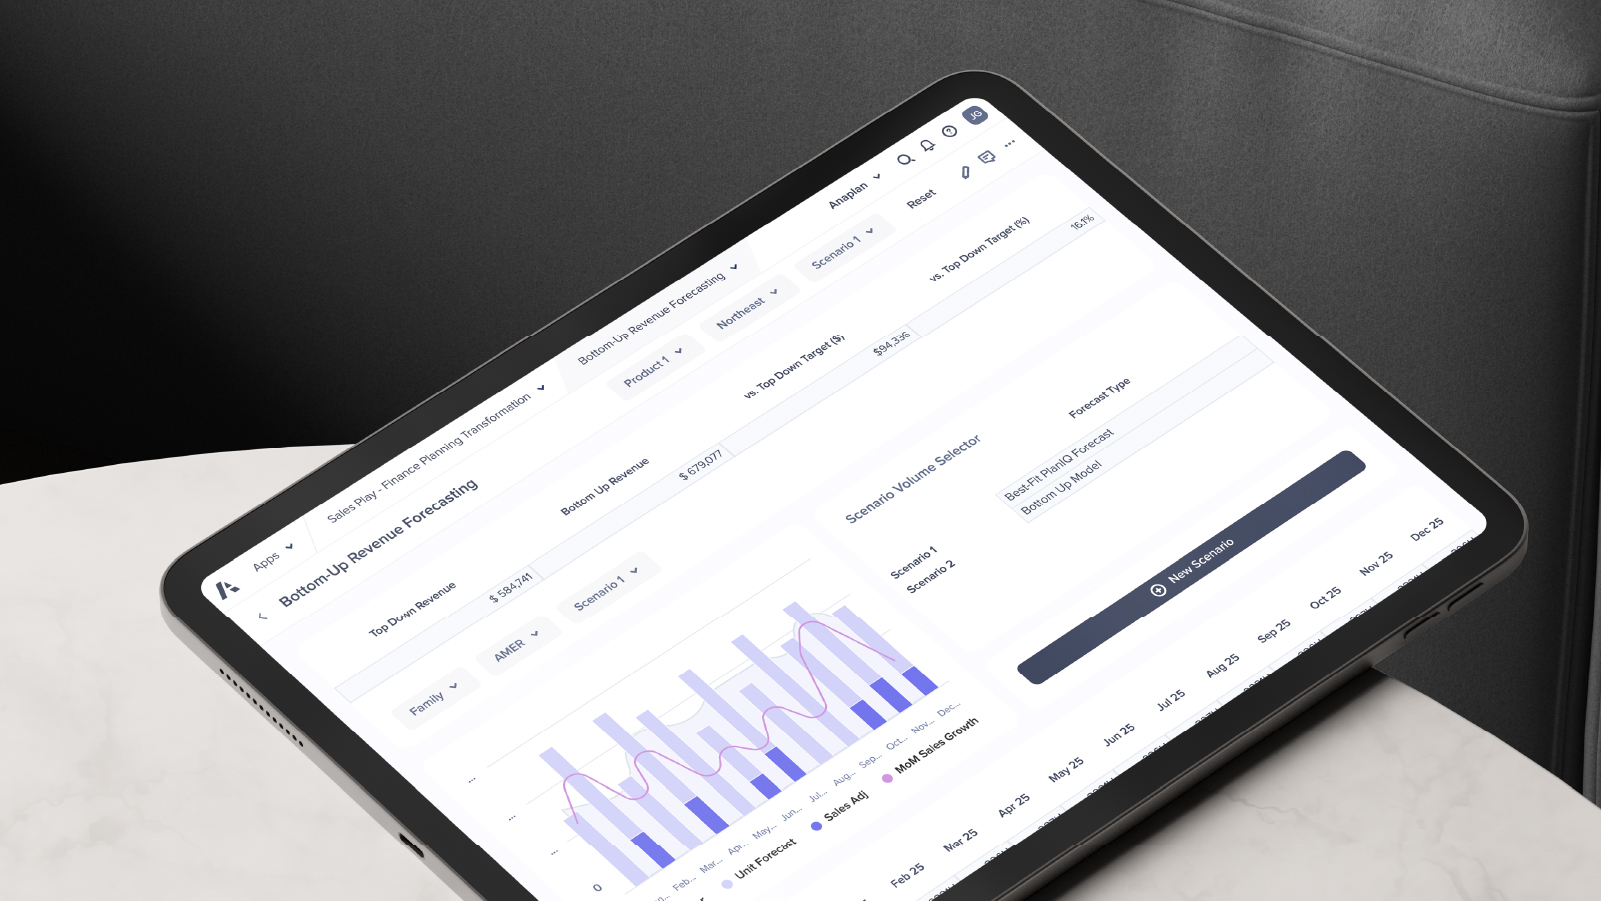
A tablet displaying the Anaplan Bottom-Up Revenue Forecasting interface. The screen shows scenario selection, forecast types, and a combined bar and line chart for monthly sales growth.