Marketing performance management

Align strategy and resources. Optimize marketing decisions.

AI-driven planning, analysis, and reporting solutions for marketing performance management.
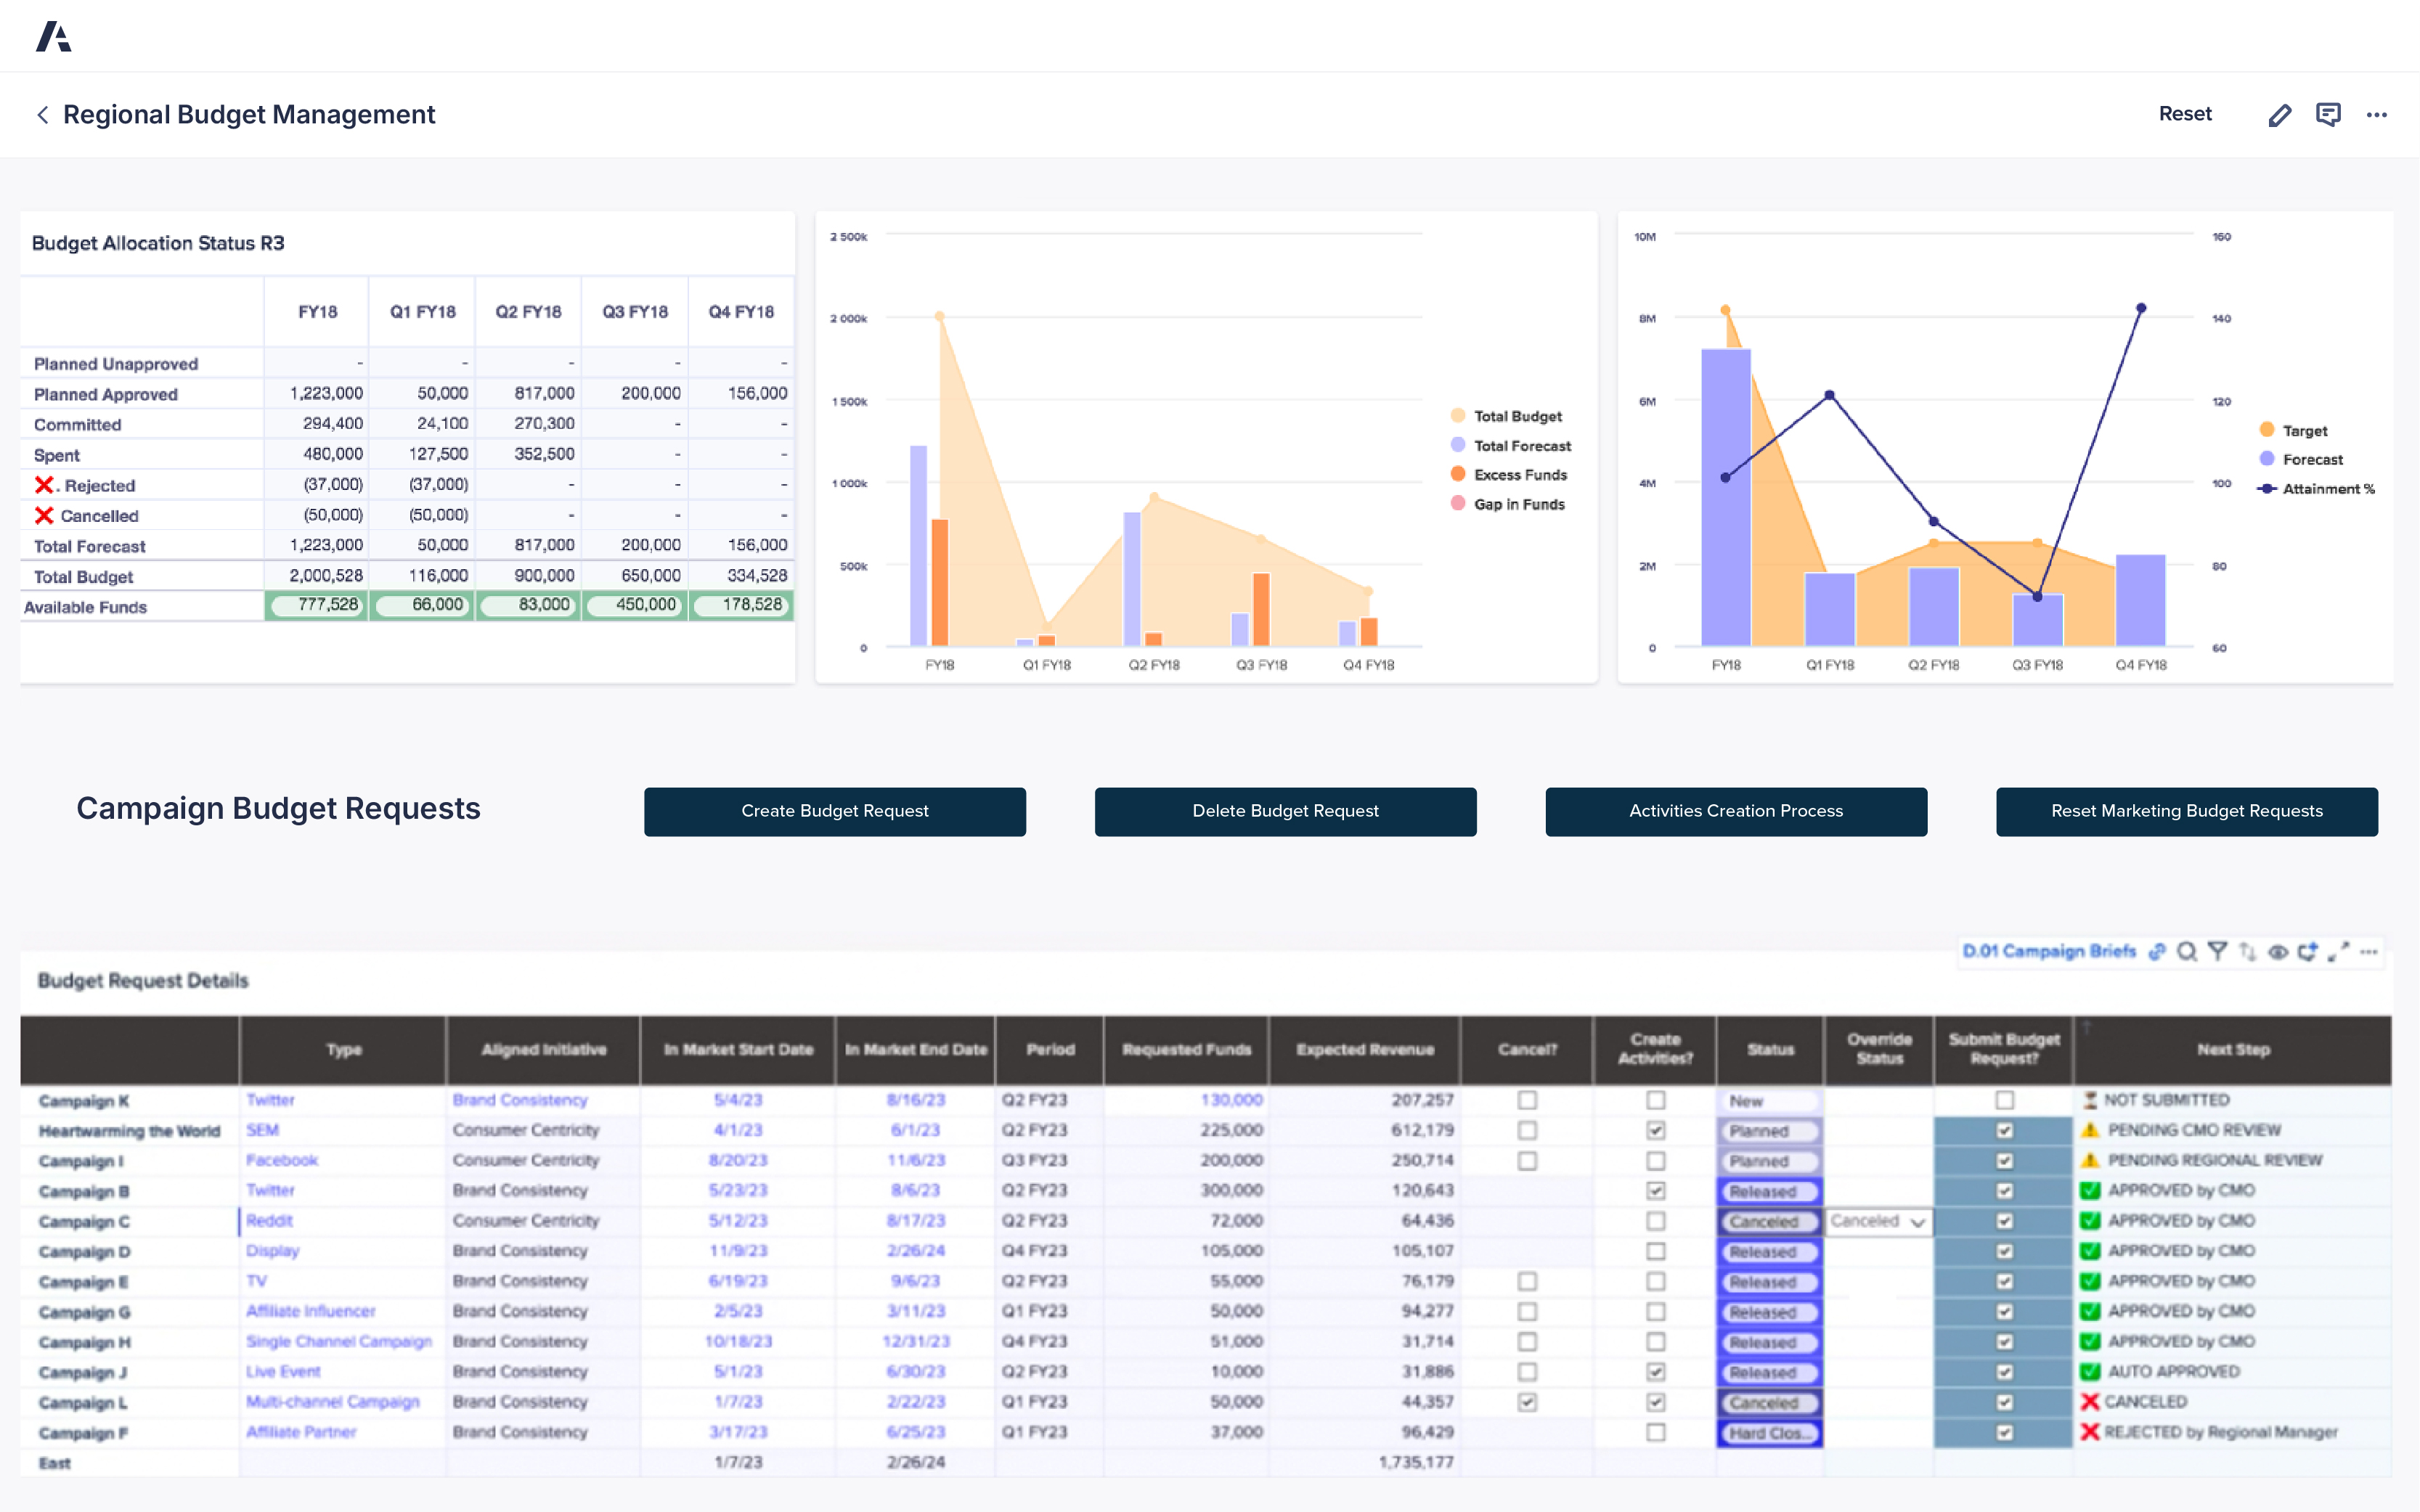
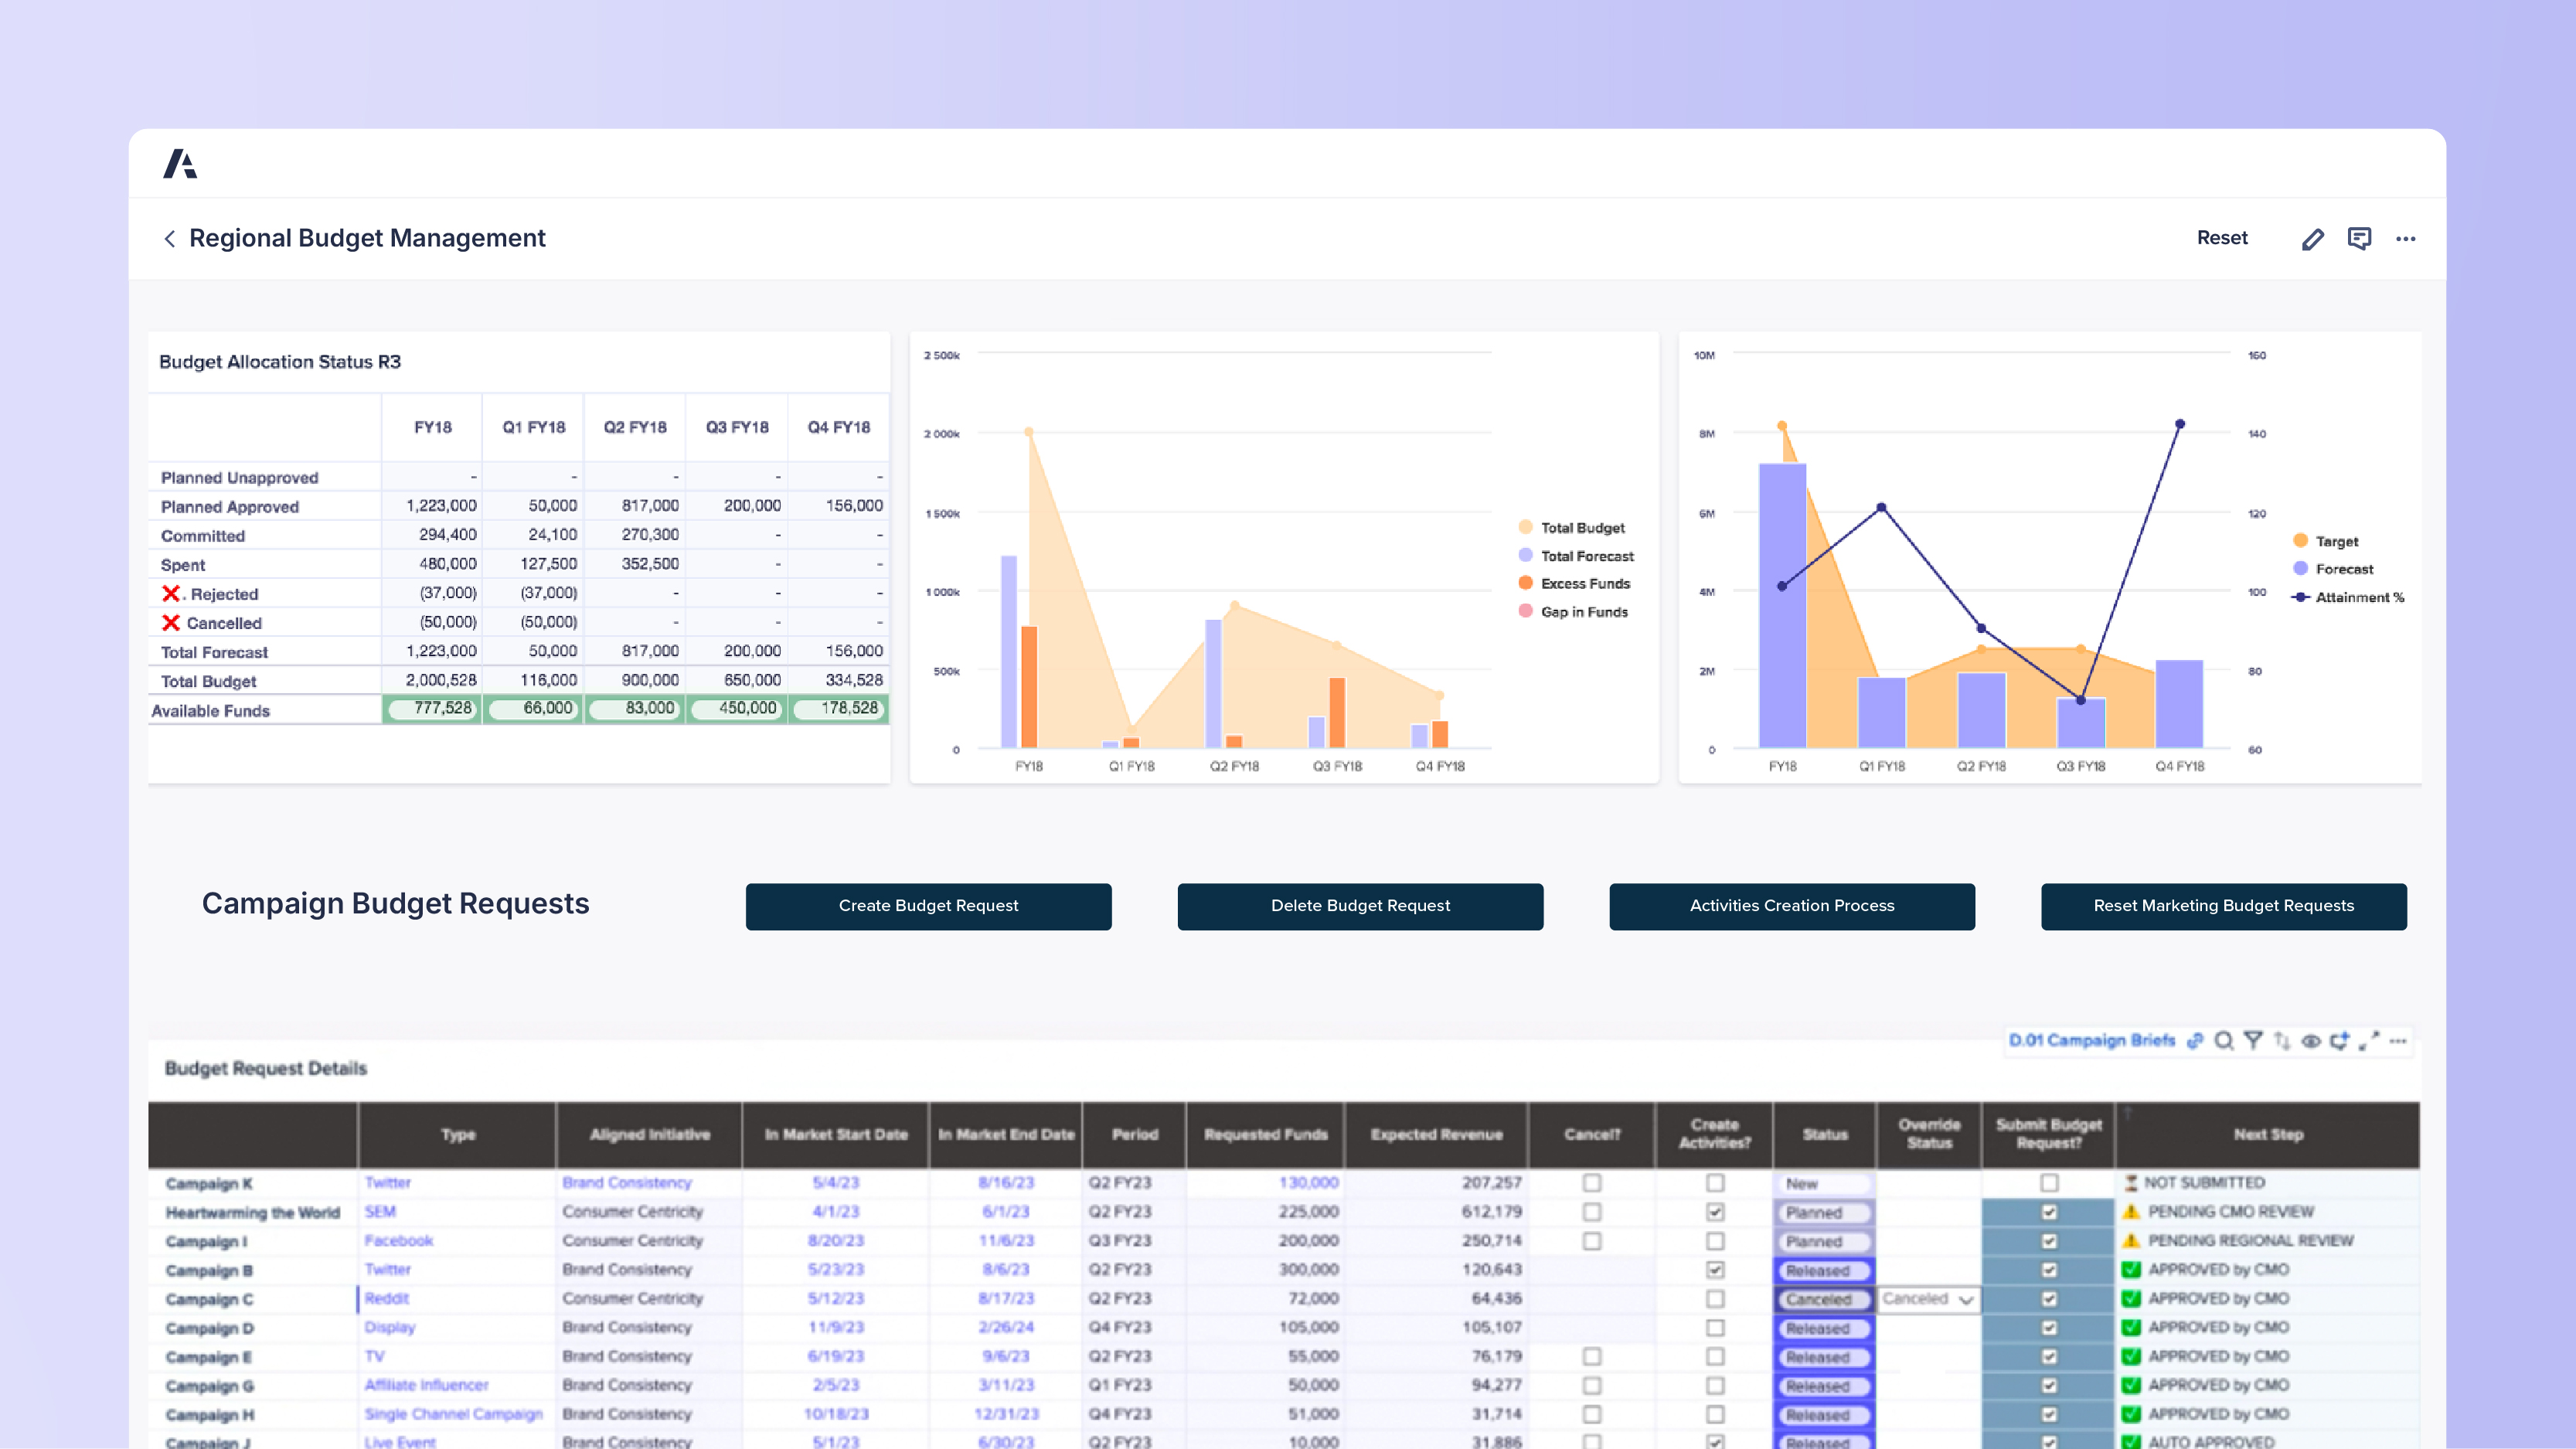
Dashboard titled Regional Budget Management. Top left shows Budget Allocation Status R3 table with values for FY18 and quarters Q1–Q4, listing Planned Unapproved, Planned Approved (1,223,000), Committed (294,400–270,300), Spent (480,000+), Rejected, Cancelled, Total Forecast (1,223,000–156,000), Total Budget (2,002,528–334,528), and Available Funds (777,528–178,528). Middle chart compares Total Budget, Total Forecast, Excess Funds, and Gap in Funds for FY18 and Q1–Q4 FY18. Right chart shows bar graph for Target vs Forecast with a line for Attainment %. Below, Campaign Budget Requests includes buttons: Create Budget Request, Delete Budget Request, Activities Creation Process, Reset Marketing Budget Requests. Bottom table Budget Request Details lists campaigns (Twitter, SEM, Facebook, YouTube, Reddit, Display, TV, Affiliate Influencer, etc.), aligned initiatives (Brand Consistency, Consumer Centricity), dates, requested funds (50,000–250,000+), expected revenue, and statuses (New, Planned, Released, Approved by CMO, Canceled, Auto Approved, Rejected by Regional Manager).

2025 ISG Research Revenue Performance Management Buyers Guide

Learn why Anaplan is again named a leader in RPM, ICM, and SPM and how - with Anaplan's comprehensive platform and AI-driven insights - you can align your GTM teams, optimize your strategy, and drive growth.
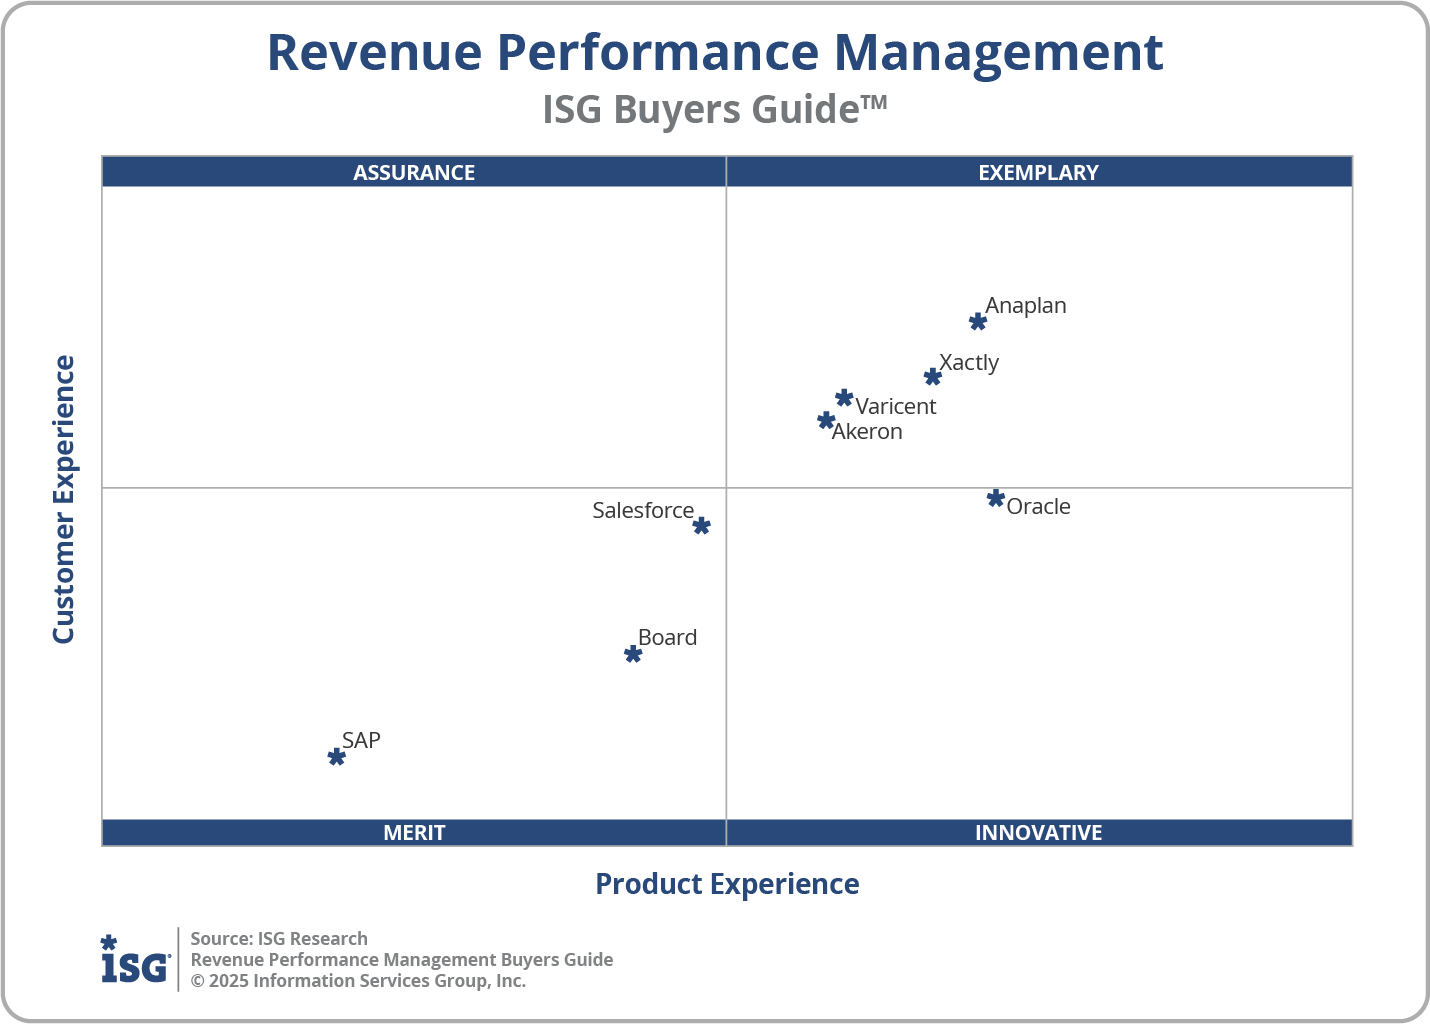
ISG Revenue Performance Management Buyers Guide 2025 showing Anaplan in the highest point of the Exemplary quadrant

Gain a complete view of your marketing performance

Anaplan provides a comprehensive suite of capabilities to connect your entire marketing organization — from financial governance to strategic planning and performance insights.
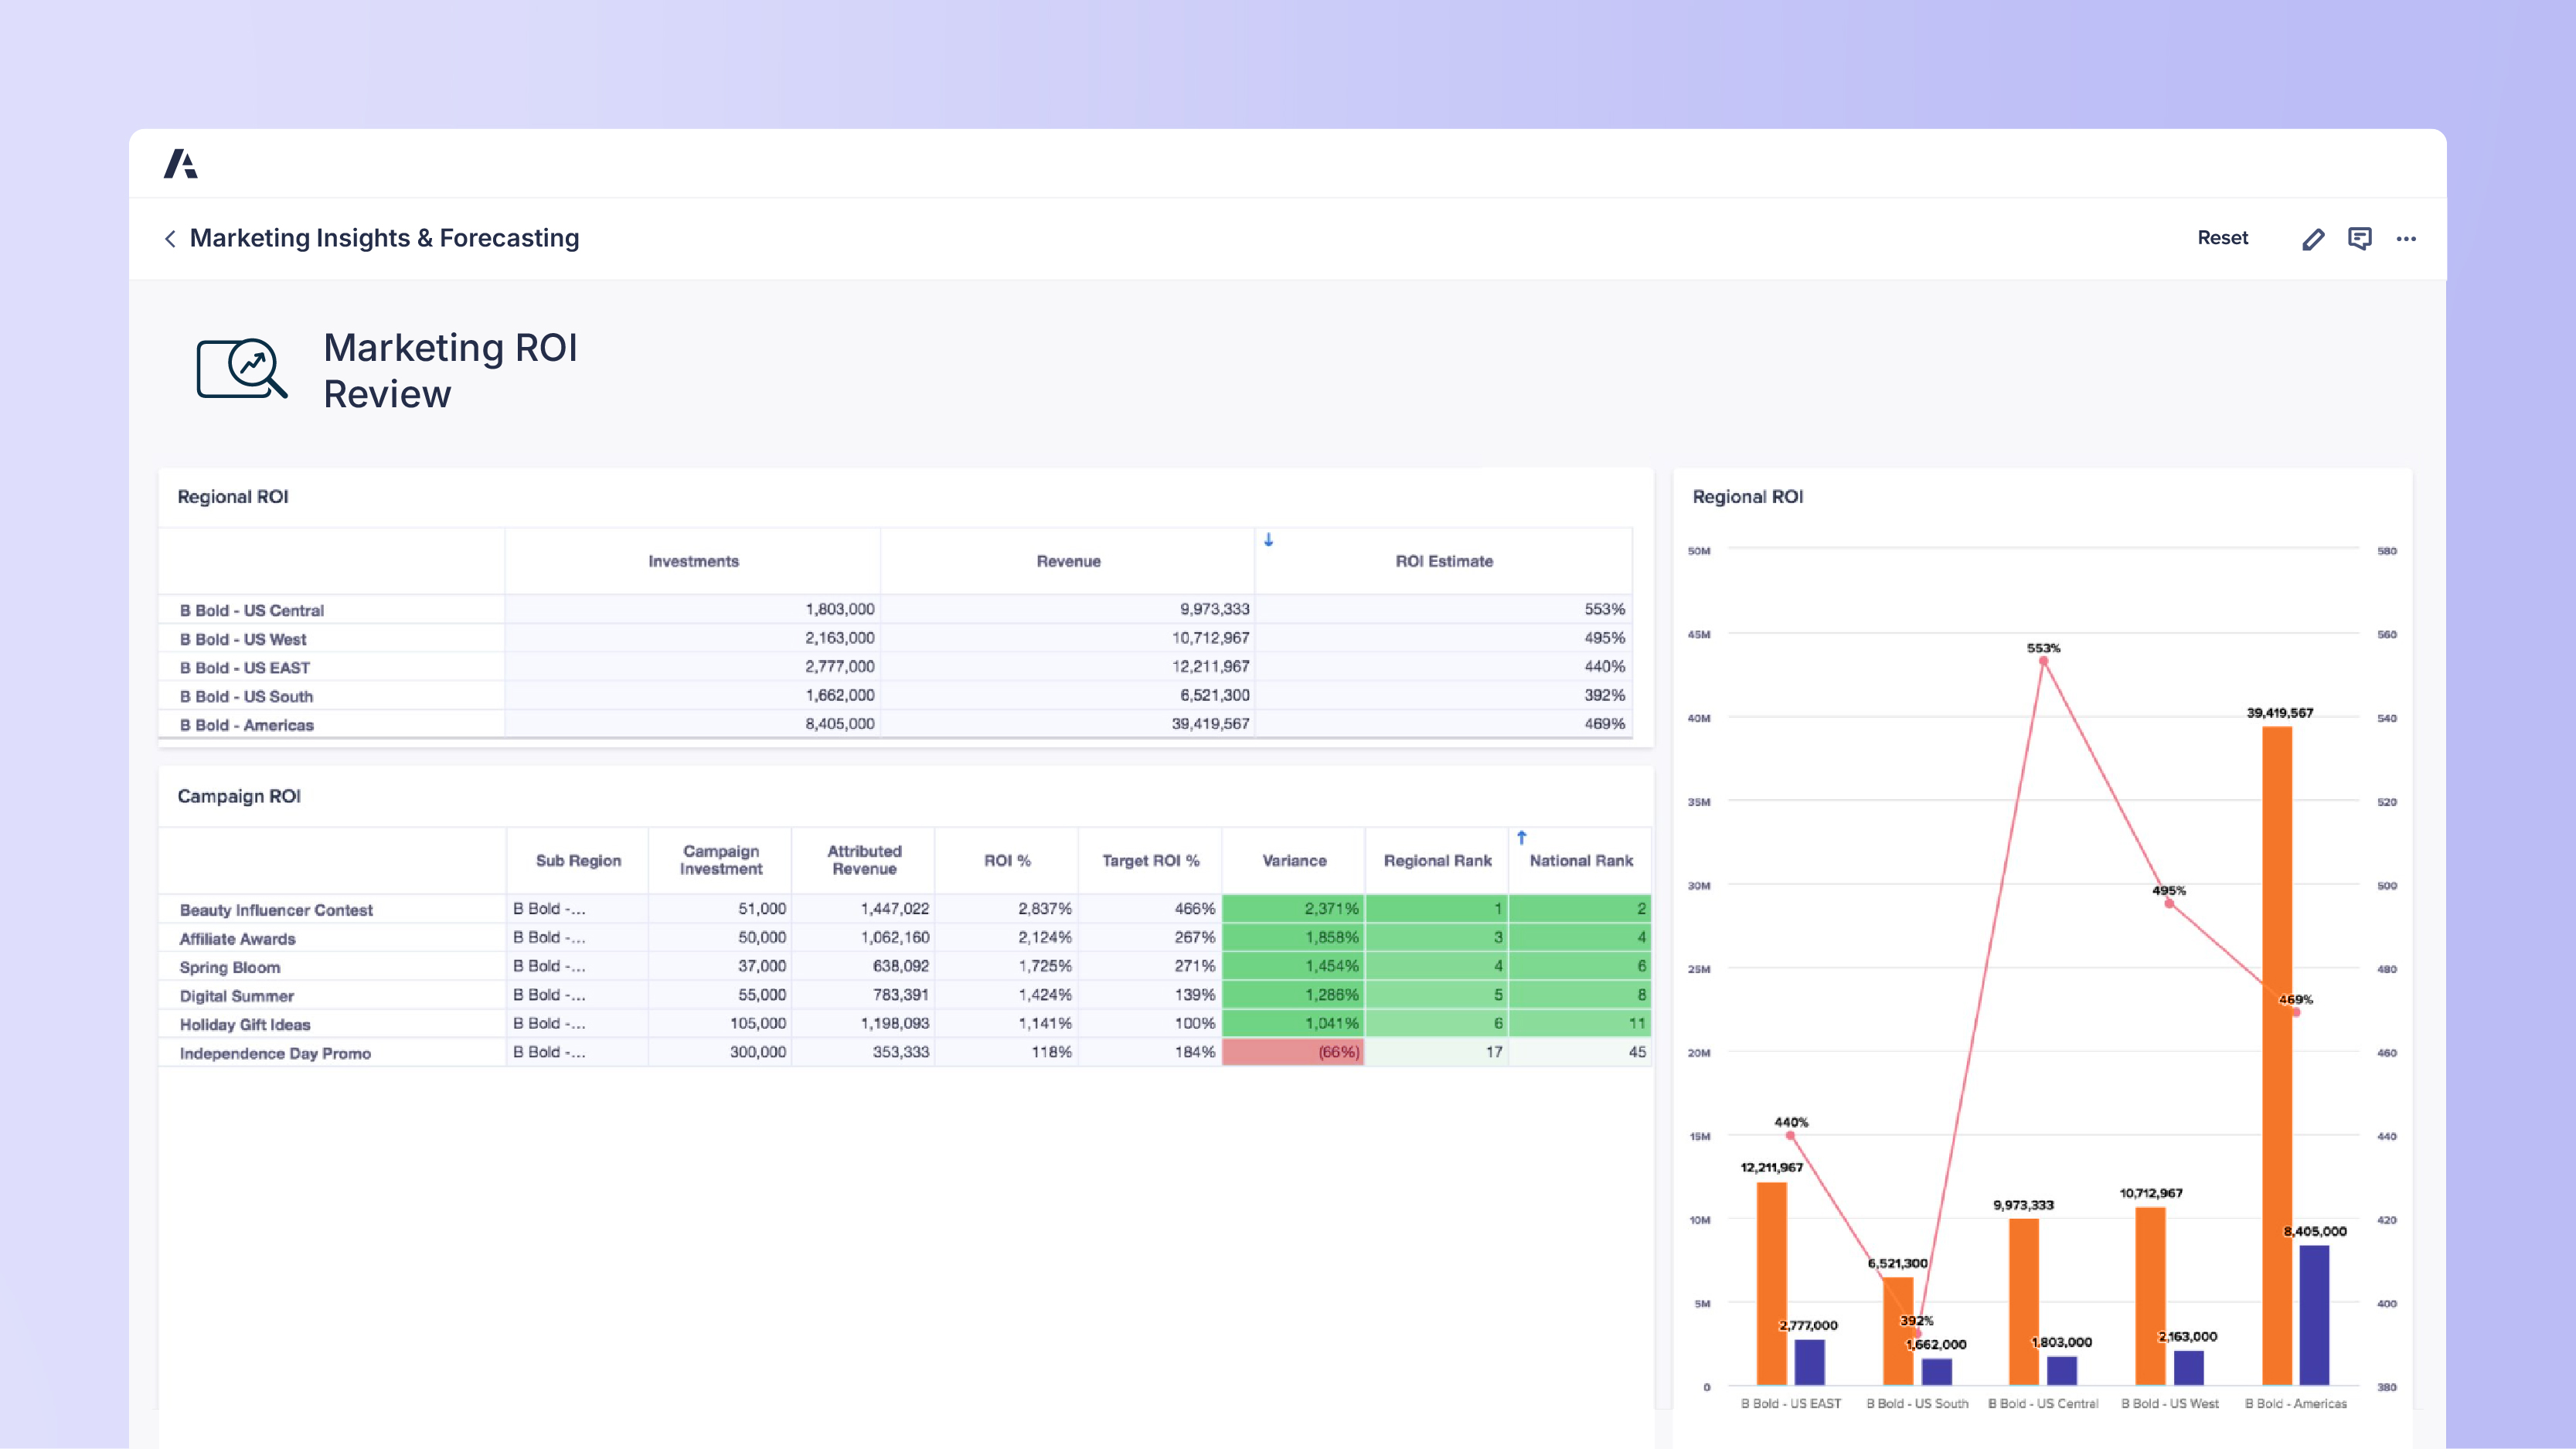
Dashboard titled Marketing Insights & Forecasting. Section heading Marketing ROI Review. Regional ROI table shows: US Central investments 1,803,000, revenue 9,973,333, ROI 553%; US West investments 2,163,000, revenue 10,712,967, ROI 495%; US East investments 2,777,000, revenue 12,211,967, ROI 440%; US South investments 1,682,000, revenue 6,521,300, ROI 329%; Americas investments 8,405,000, revenue 38,419,567, ROI 469%. Campaign ROI table includes Beauty Influencer Contest, Affiliate Awards, Spring Bloom, Digital Summer, Holiday Gift Ideas, Independence Day Promo with campaign investment, attributed revenue, ROI %, target ROI %, variance, and regional and national rank. Right side shows Regional ROI chart with orange bars for revenue, blue bars for investment, and red line indicating ROI % across regions.

Marketing insights and forecasting

Move from reactive reporting to closed-loop marketing with proactive, data-driven decision-making.

Top marketing leaders plan with Anaplan


Discover the platform marketing leaders trust.
Be the next.

Marketing teams around the world rely on Anaplan to build a modern, connected enterprise. Shouldn’t you? 
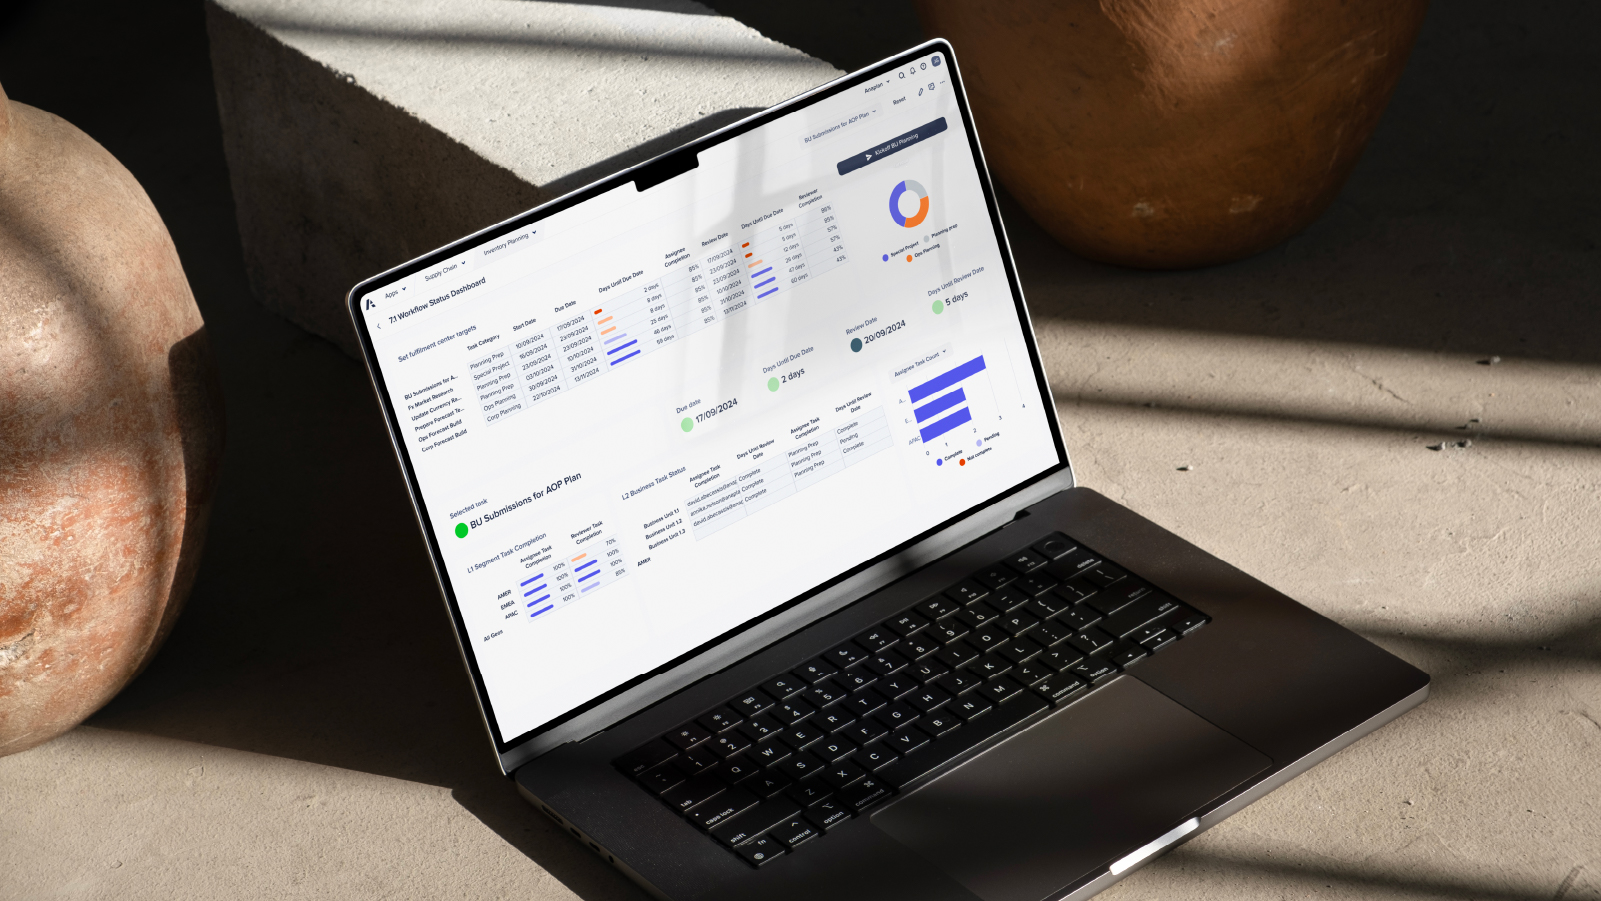
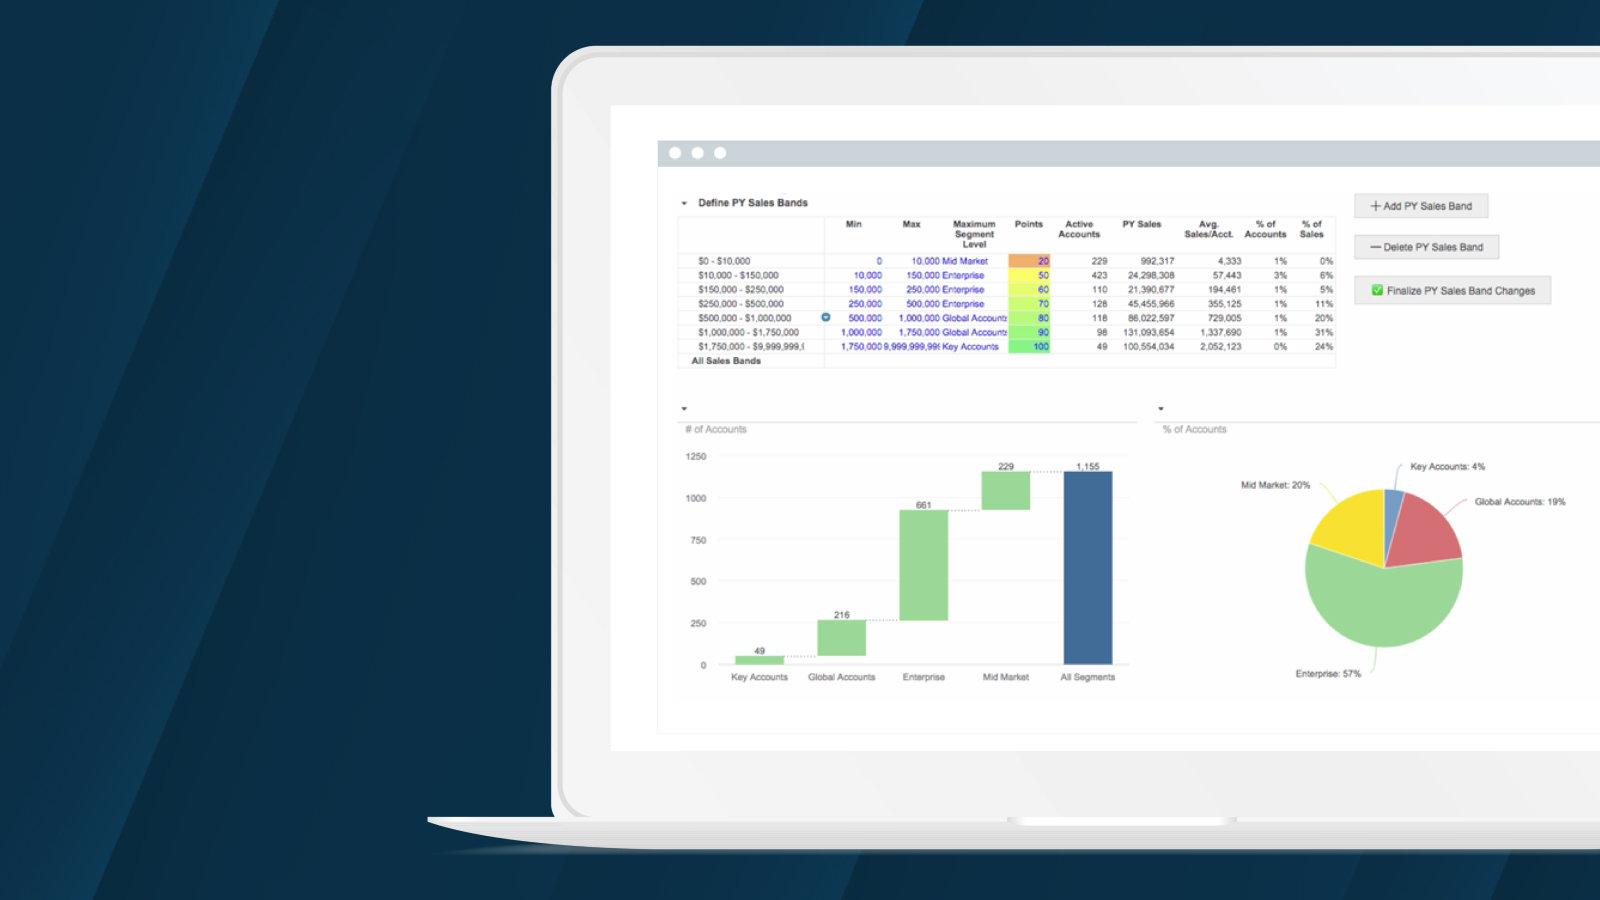
A laptop displaying a dashboard interface, positioned on a table, showcasing data and analytics.