Learn why connected enterprises drive higher shareholder returns
Sales incentives
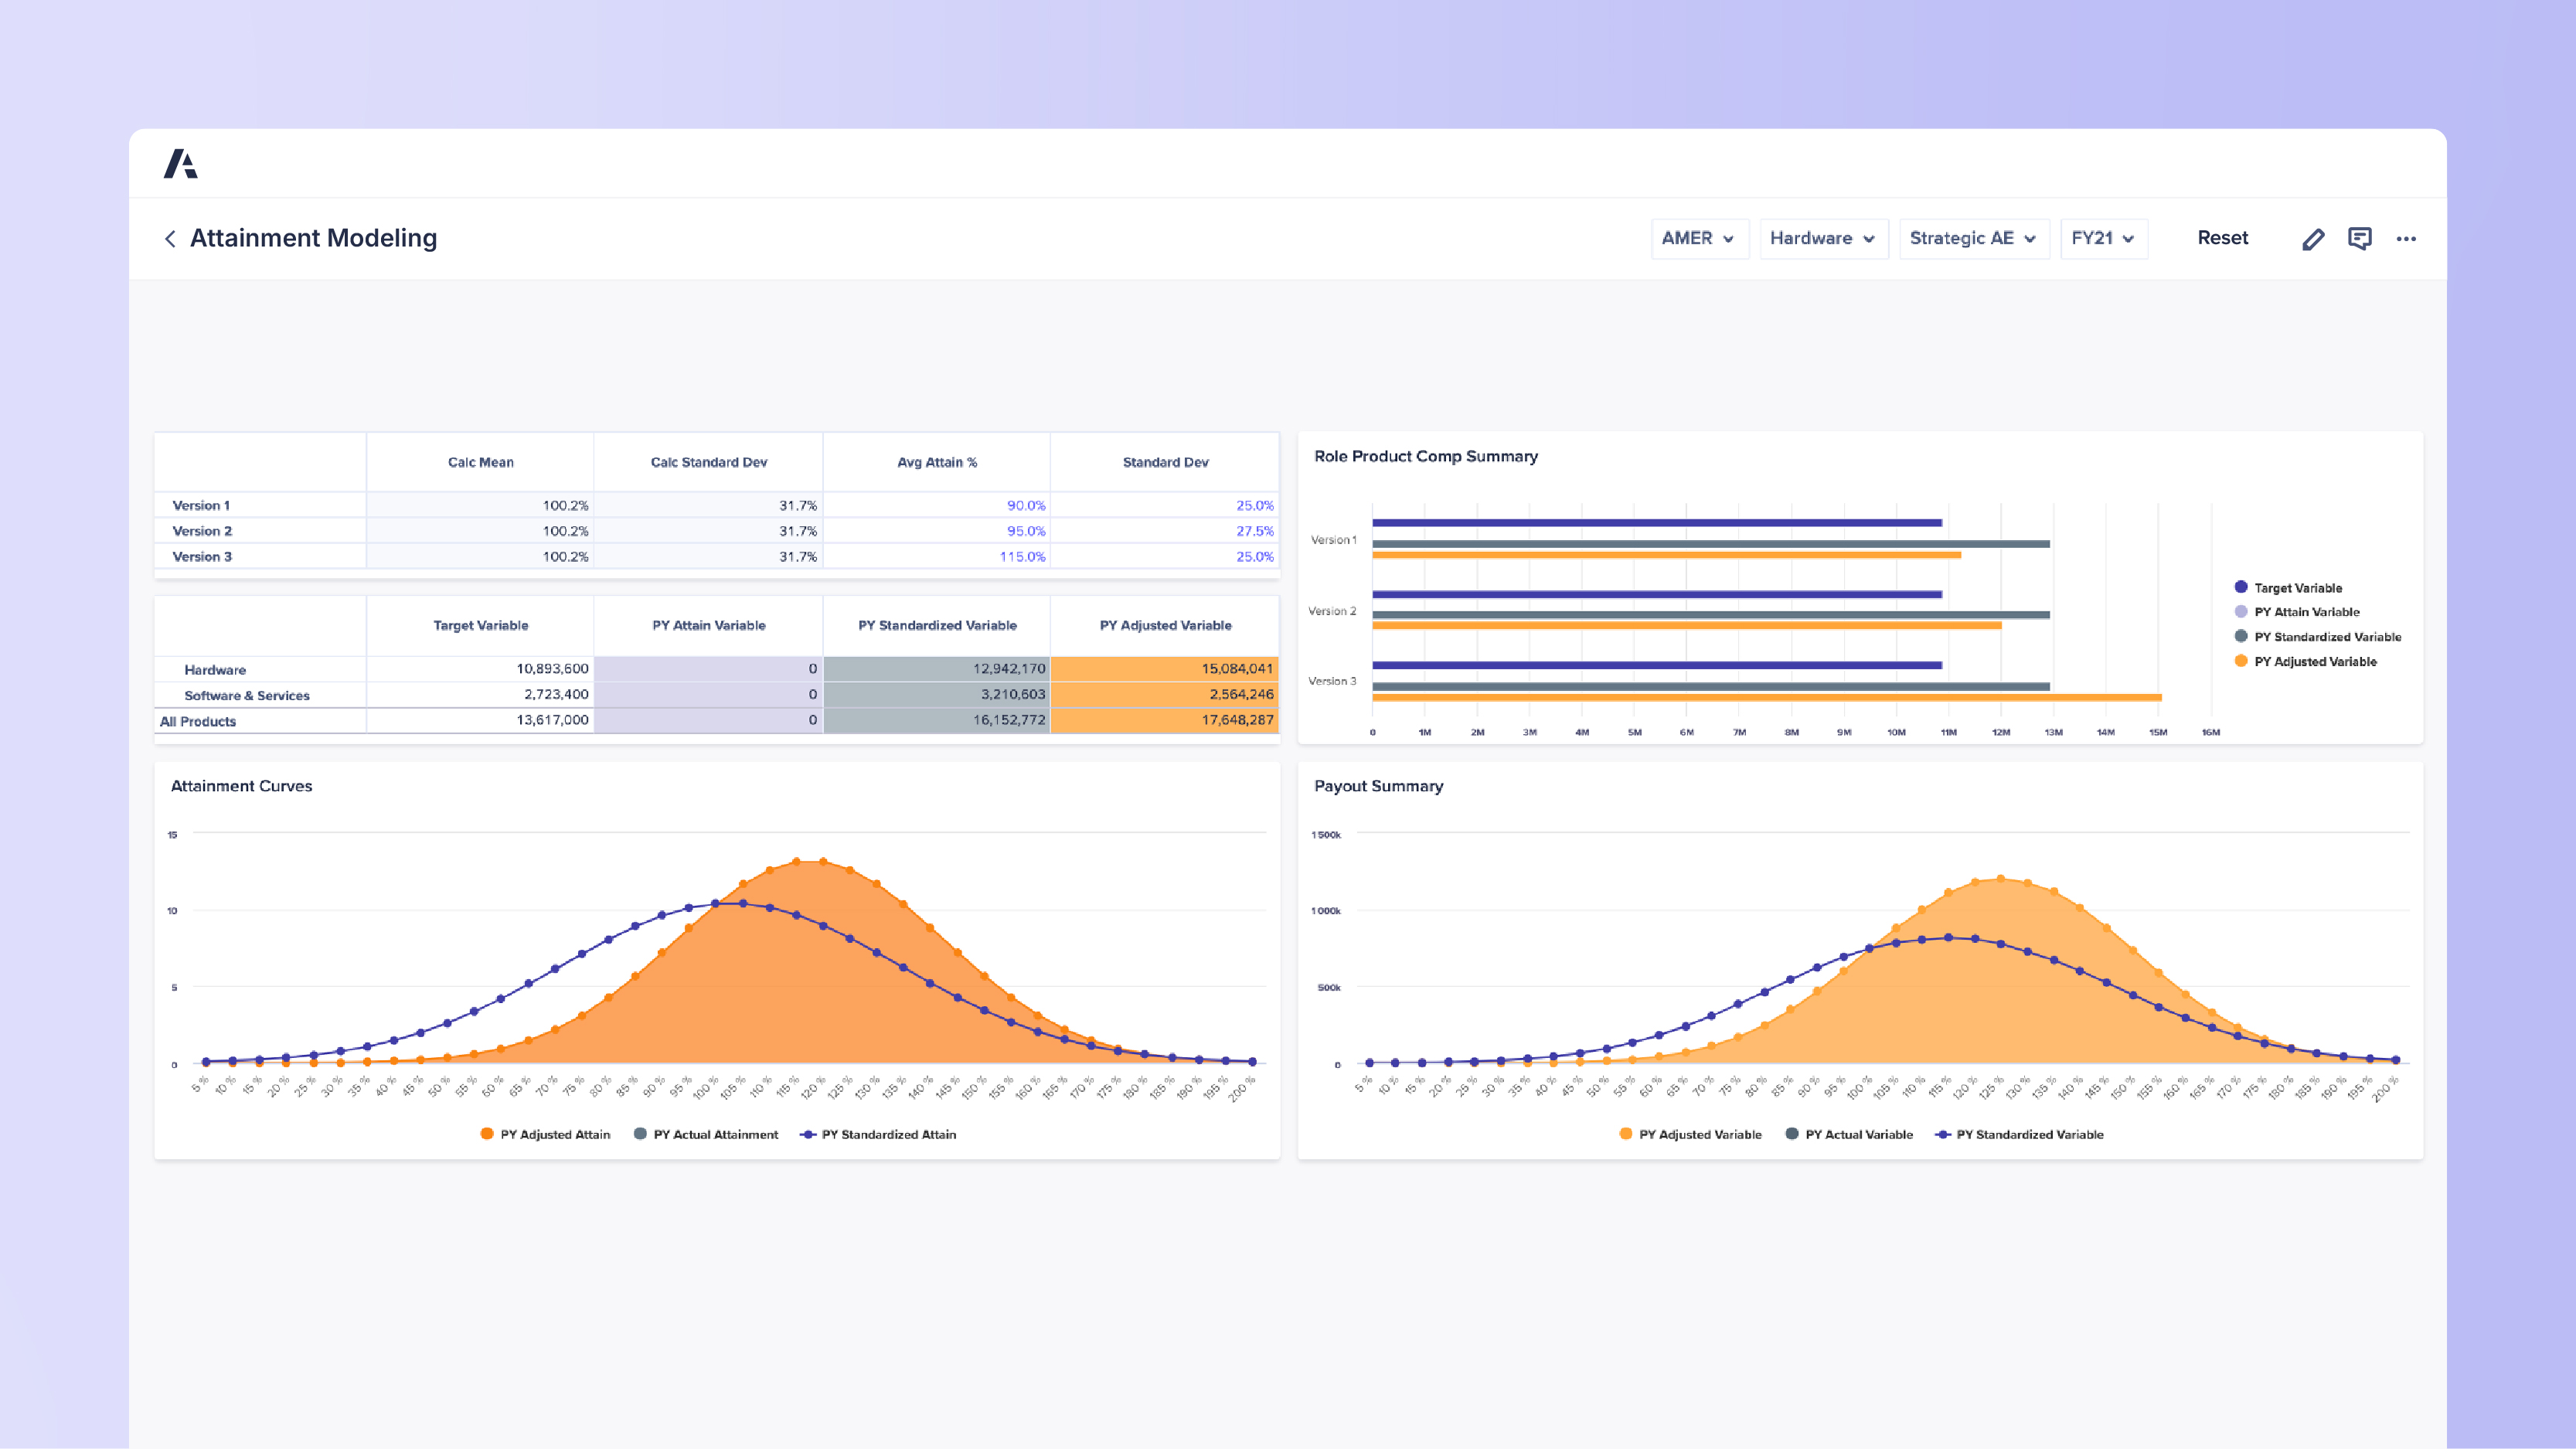
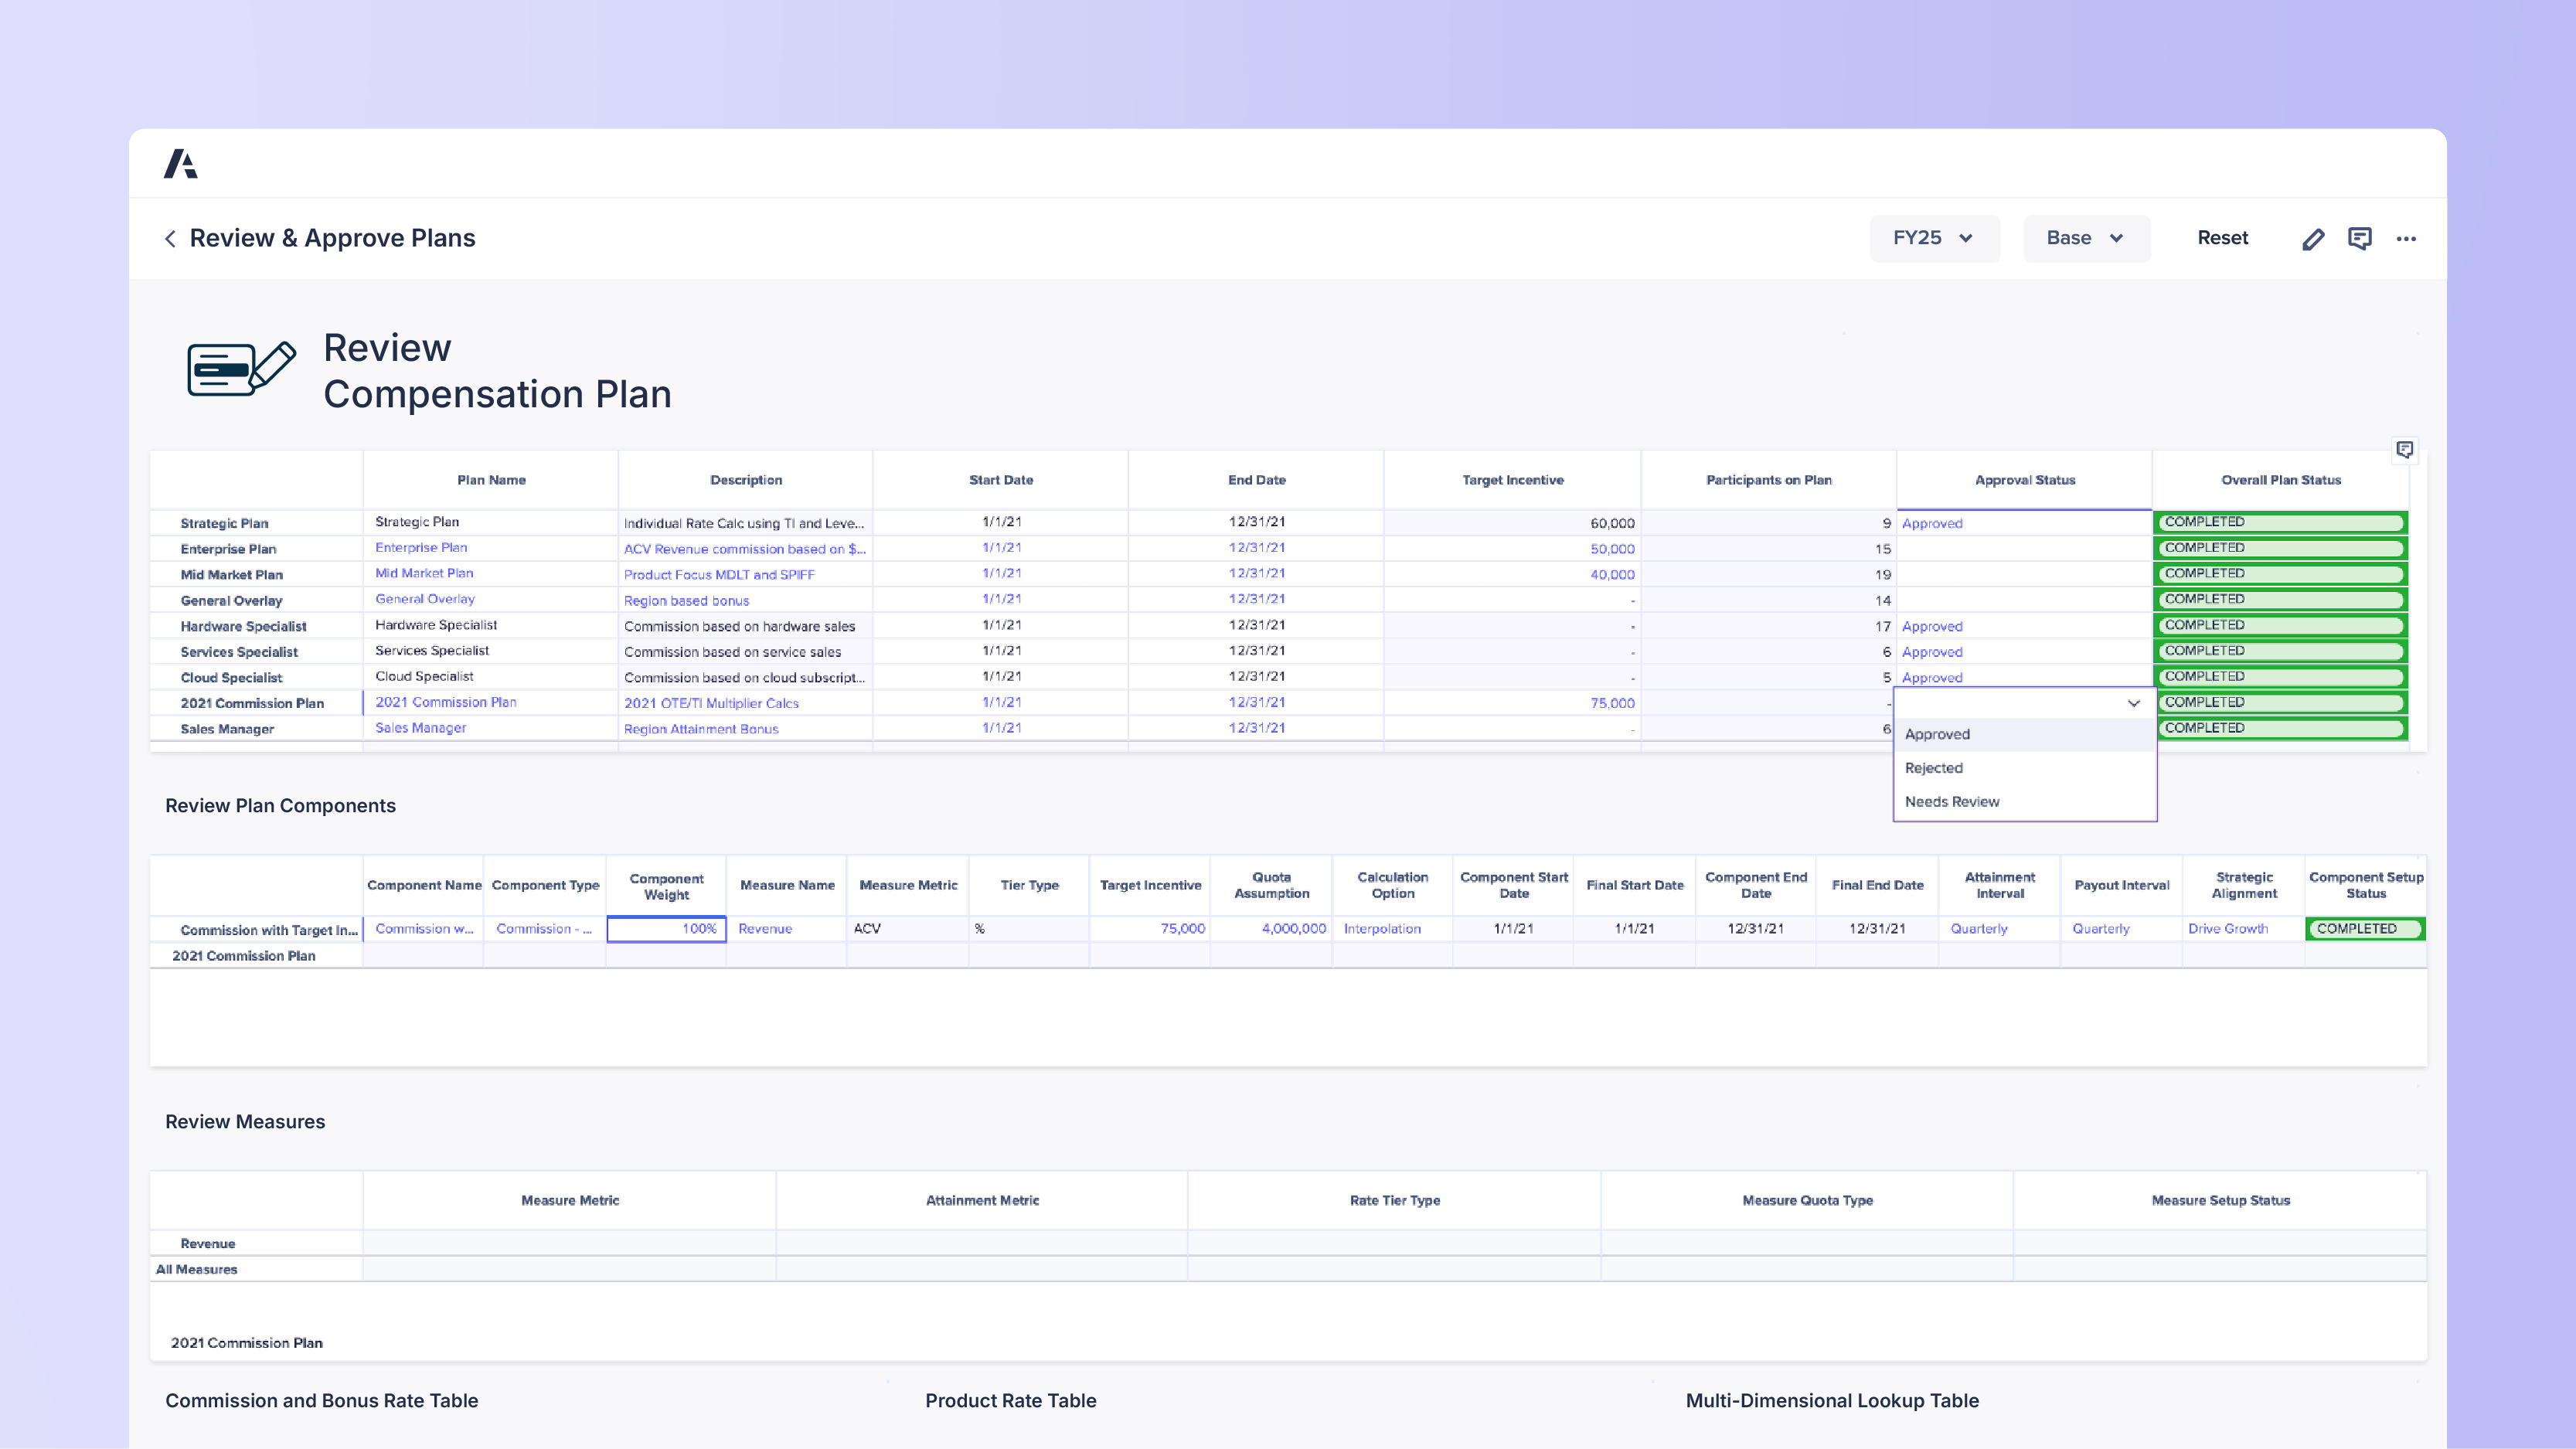
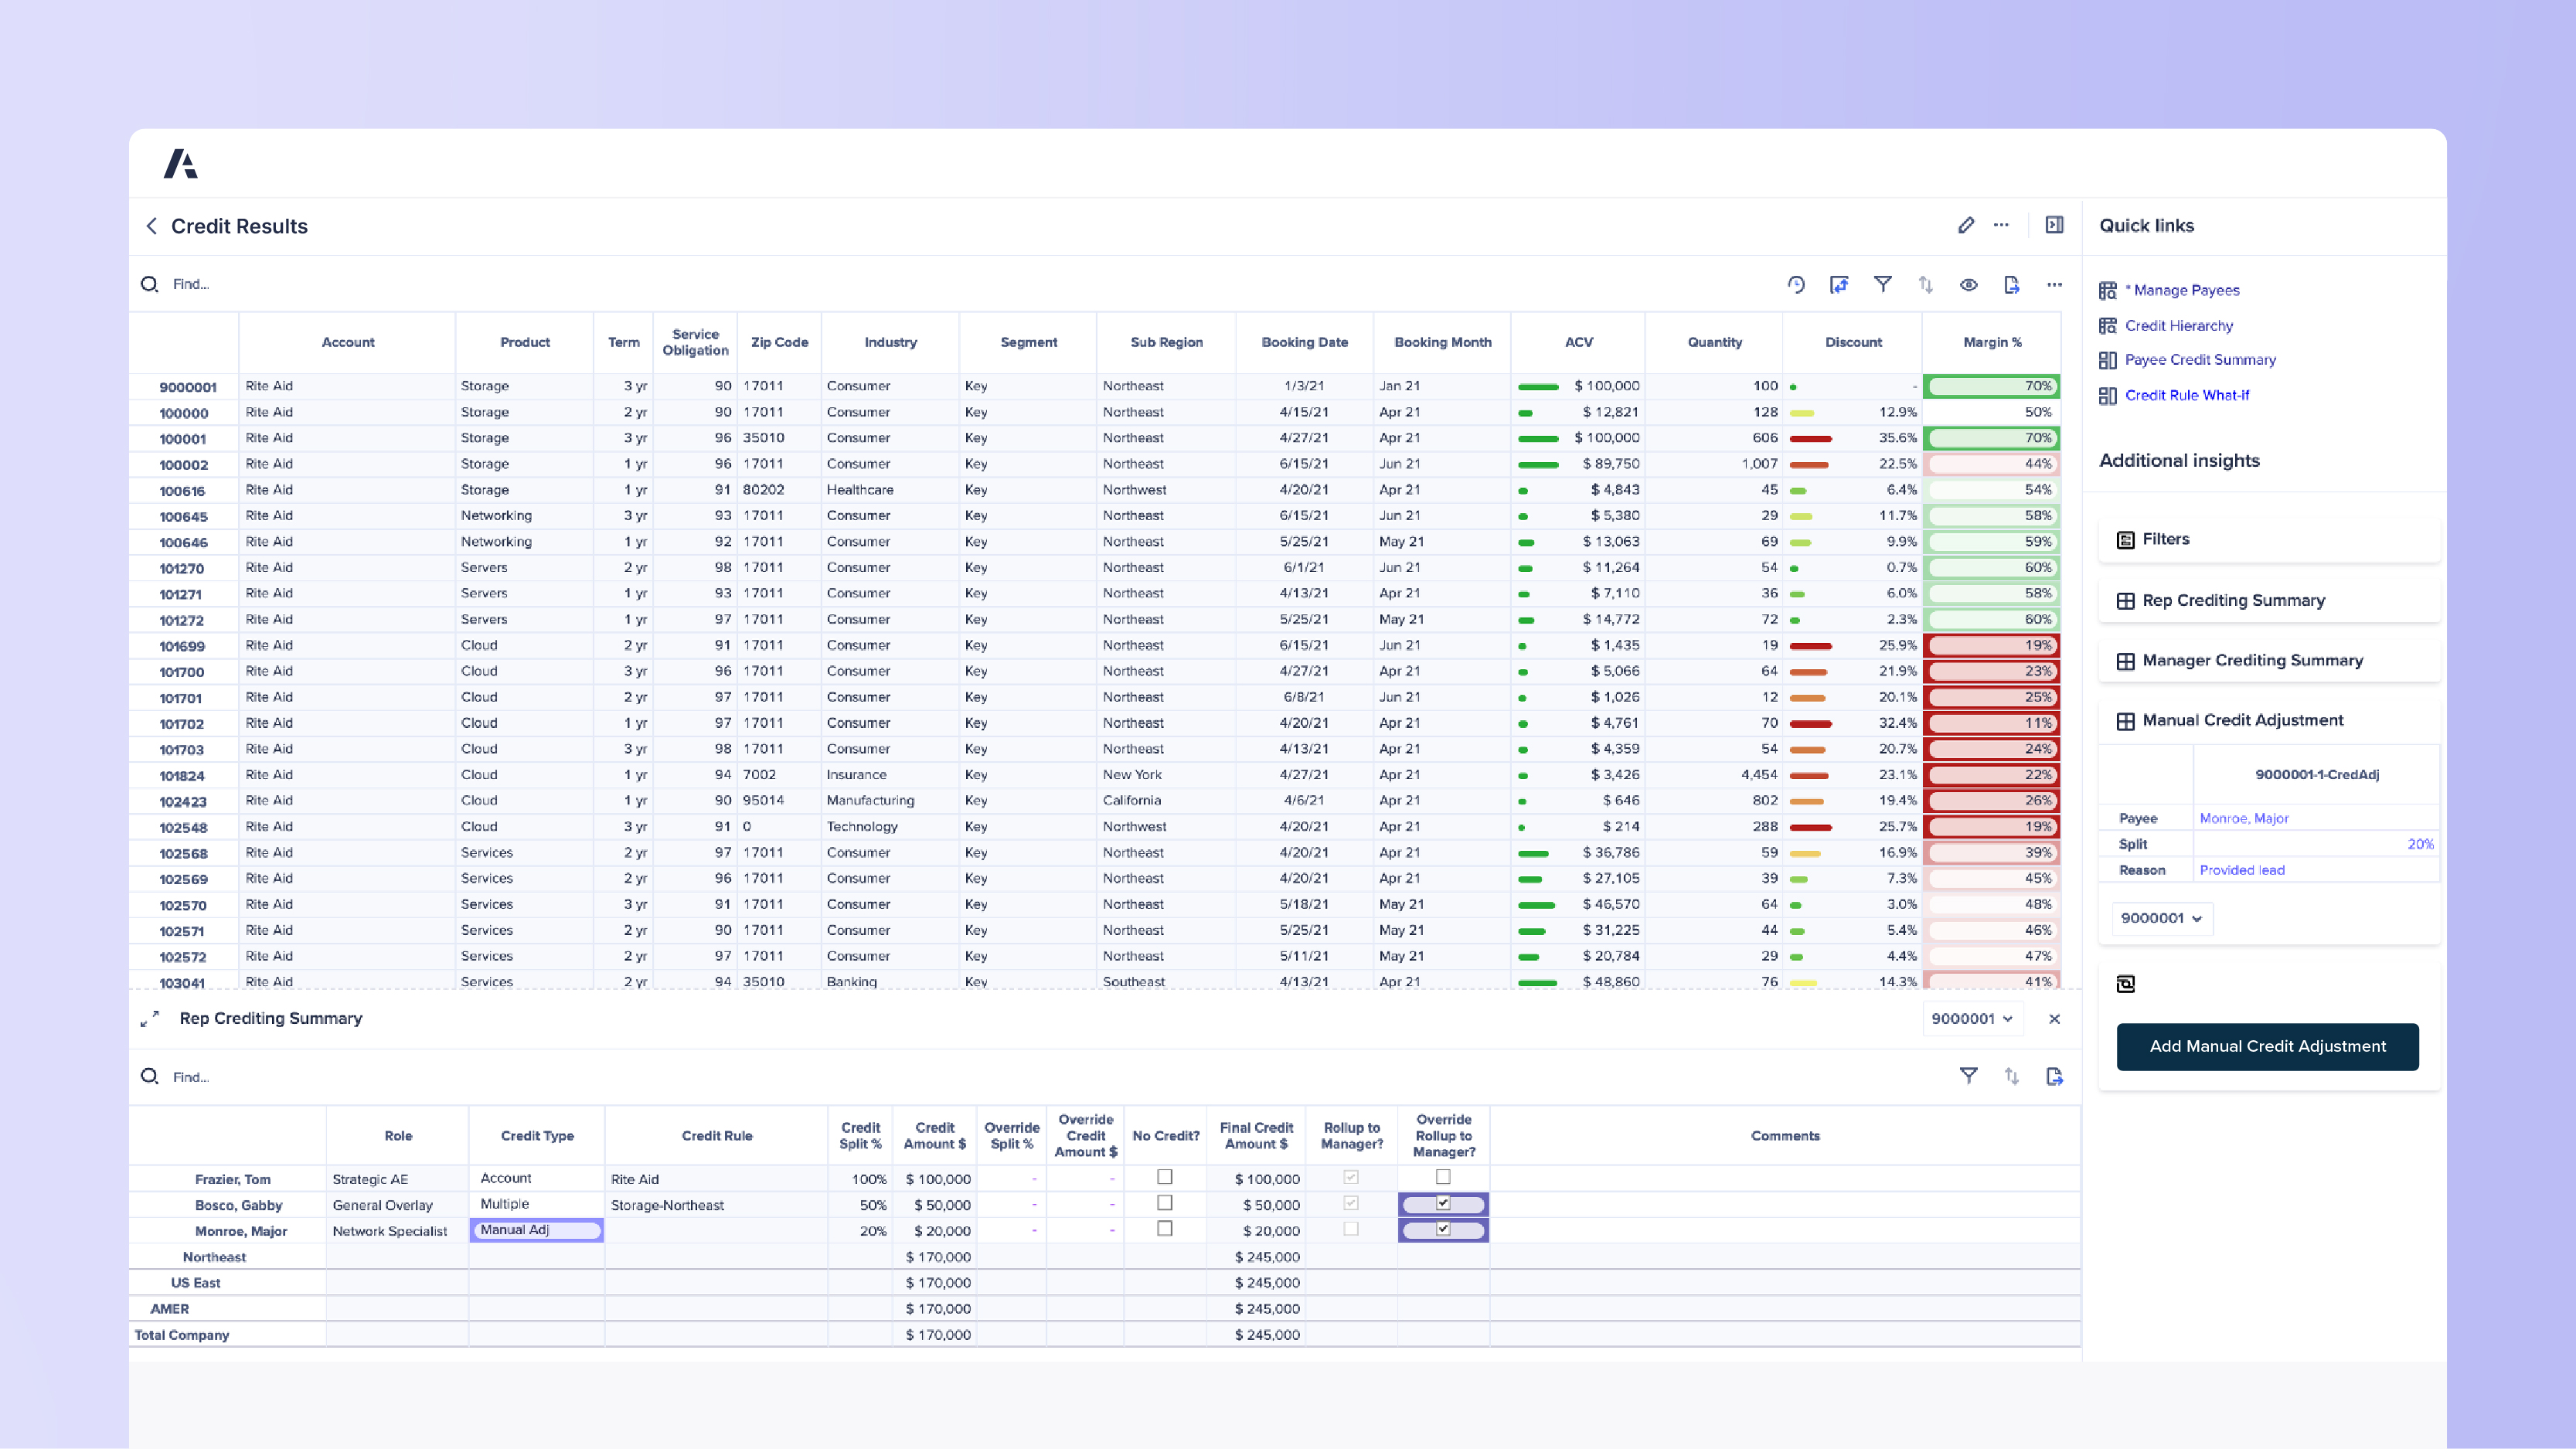
Intelligent solutions for sales incentives
Design, align, and scale incentives across hundreds of plans, thousands of payees, and millions of transactions.
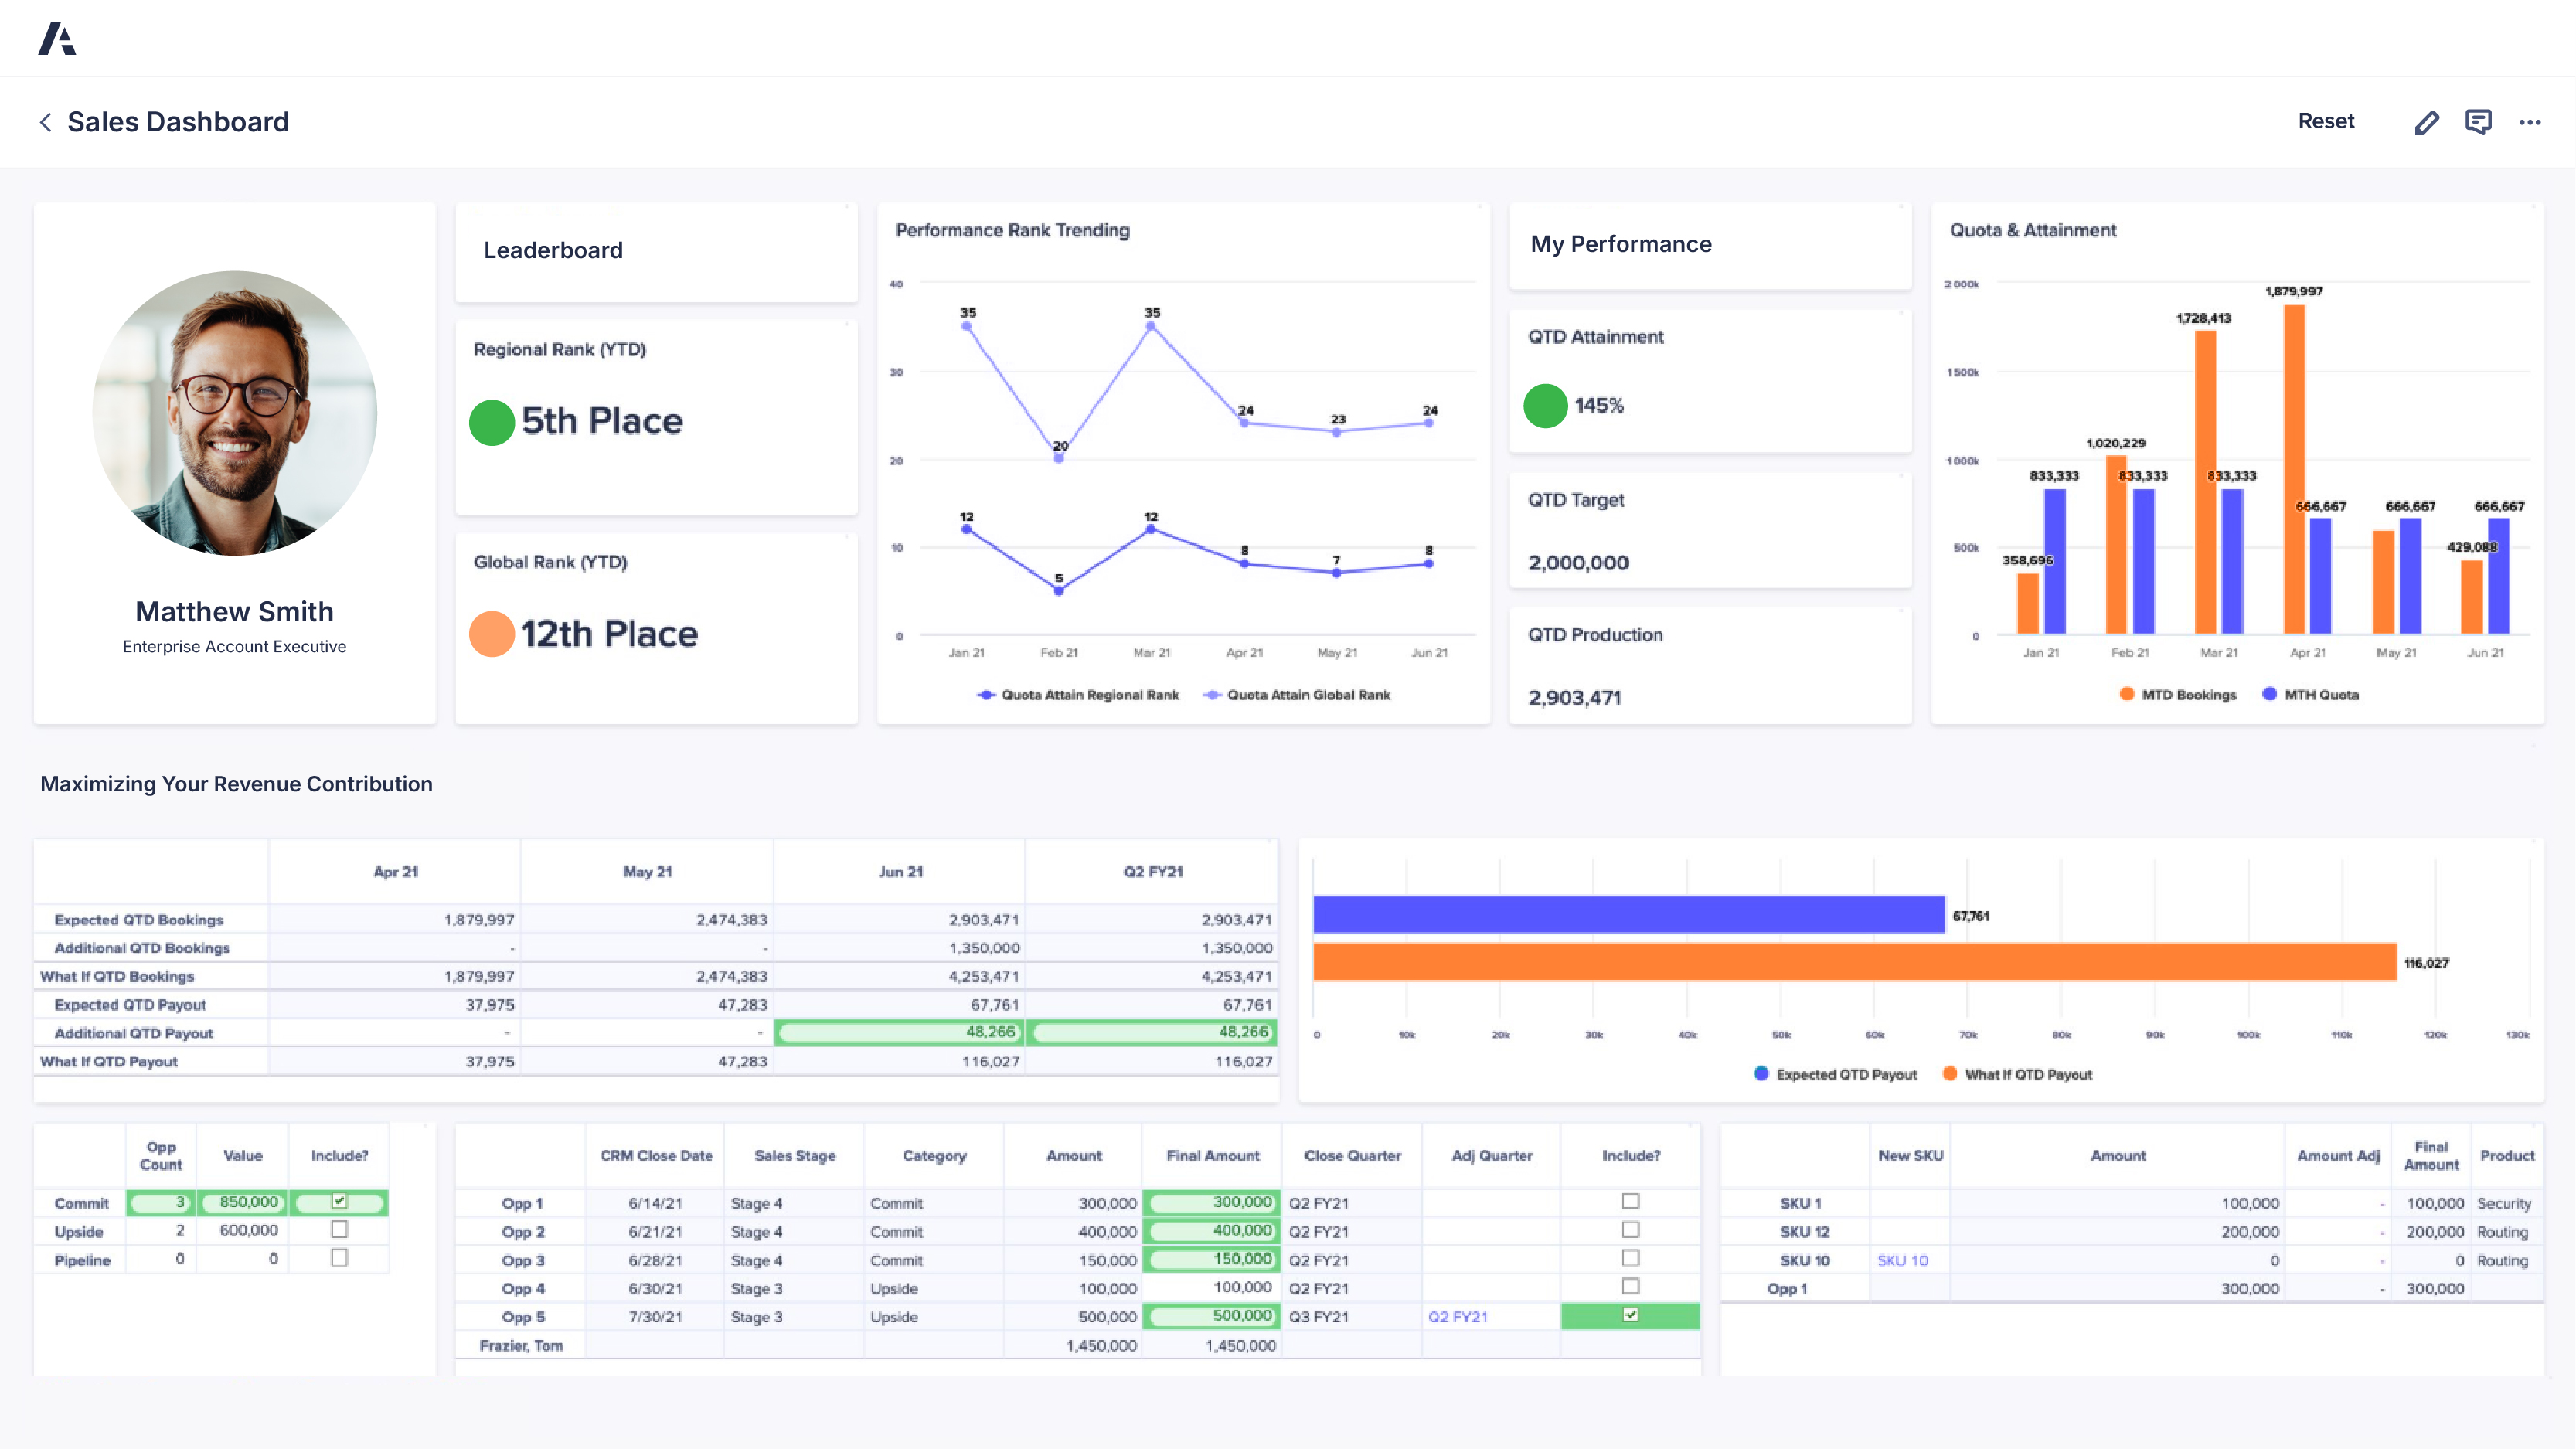
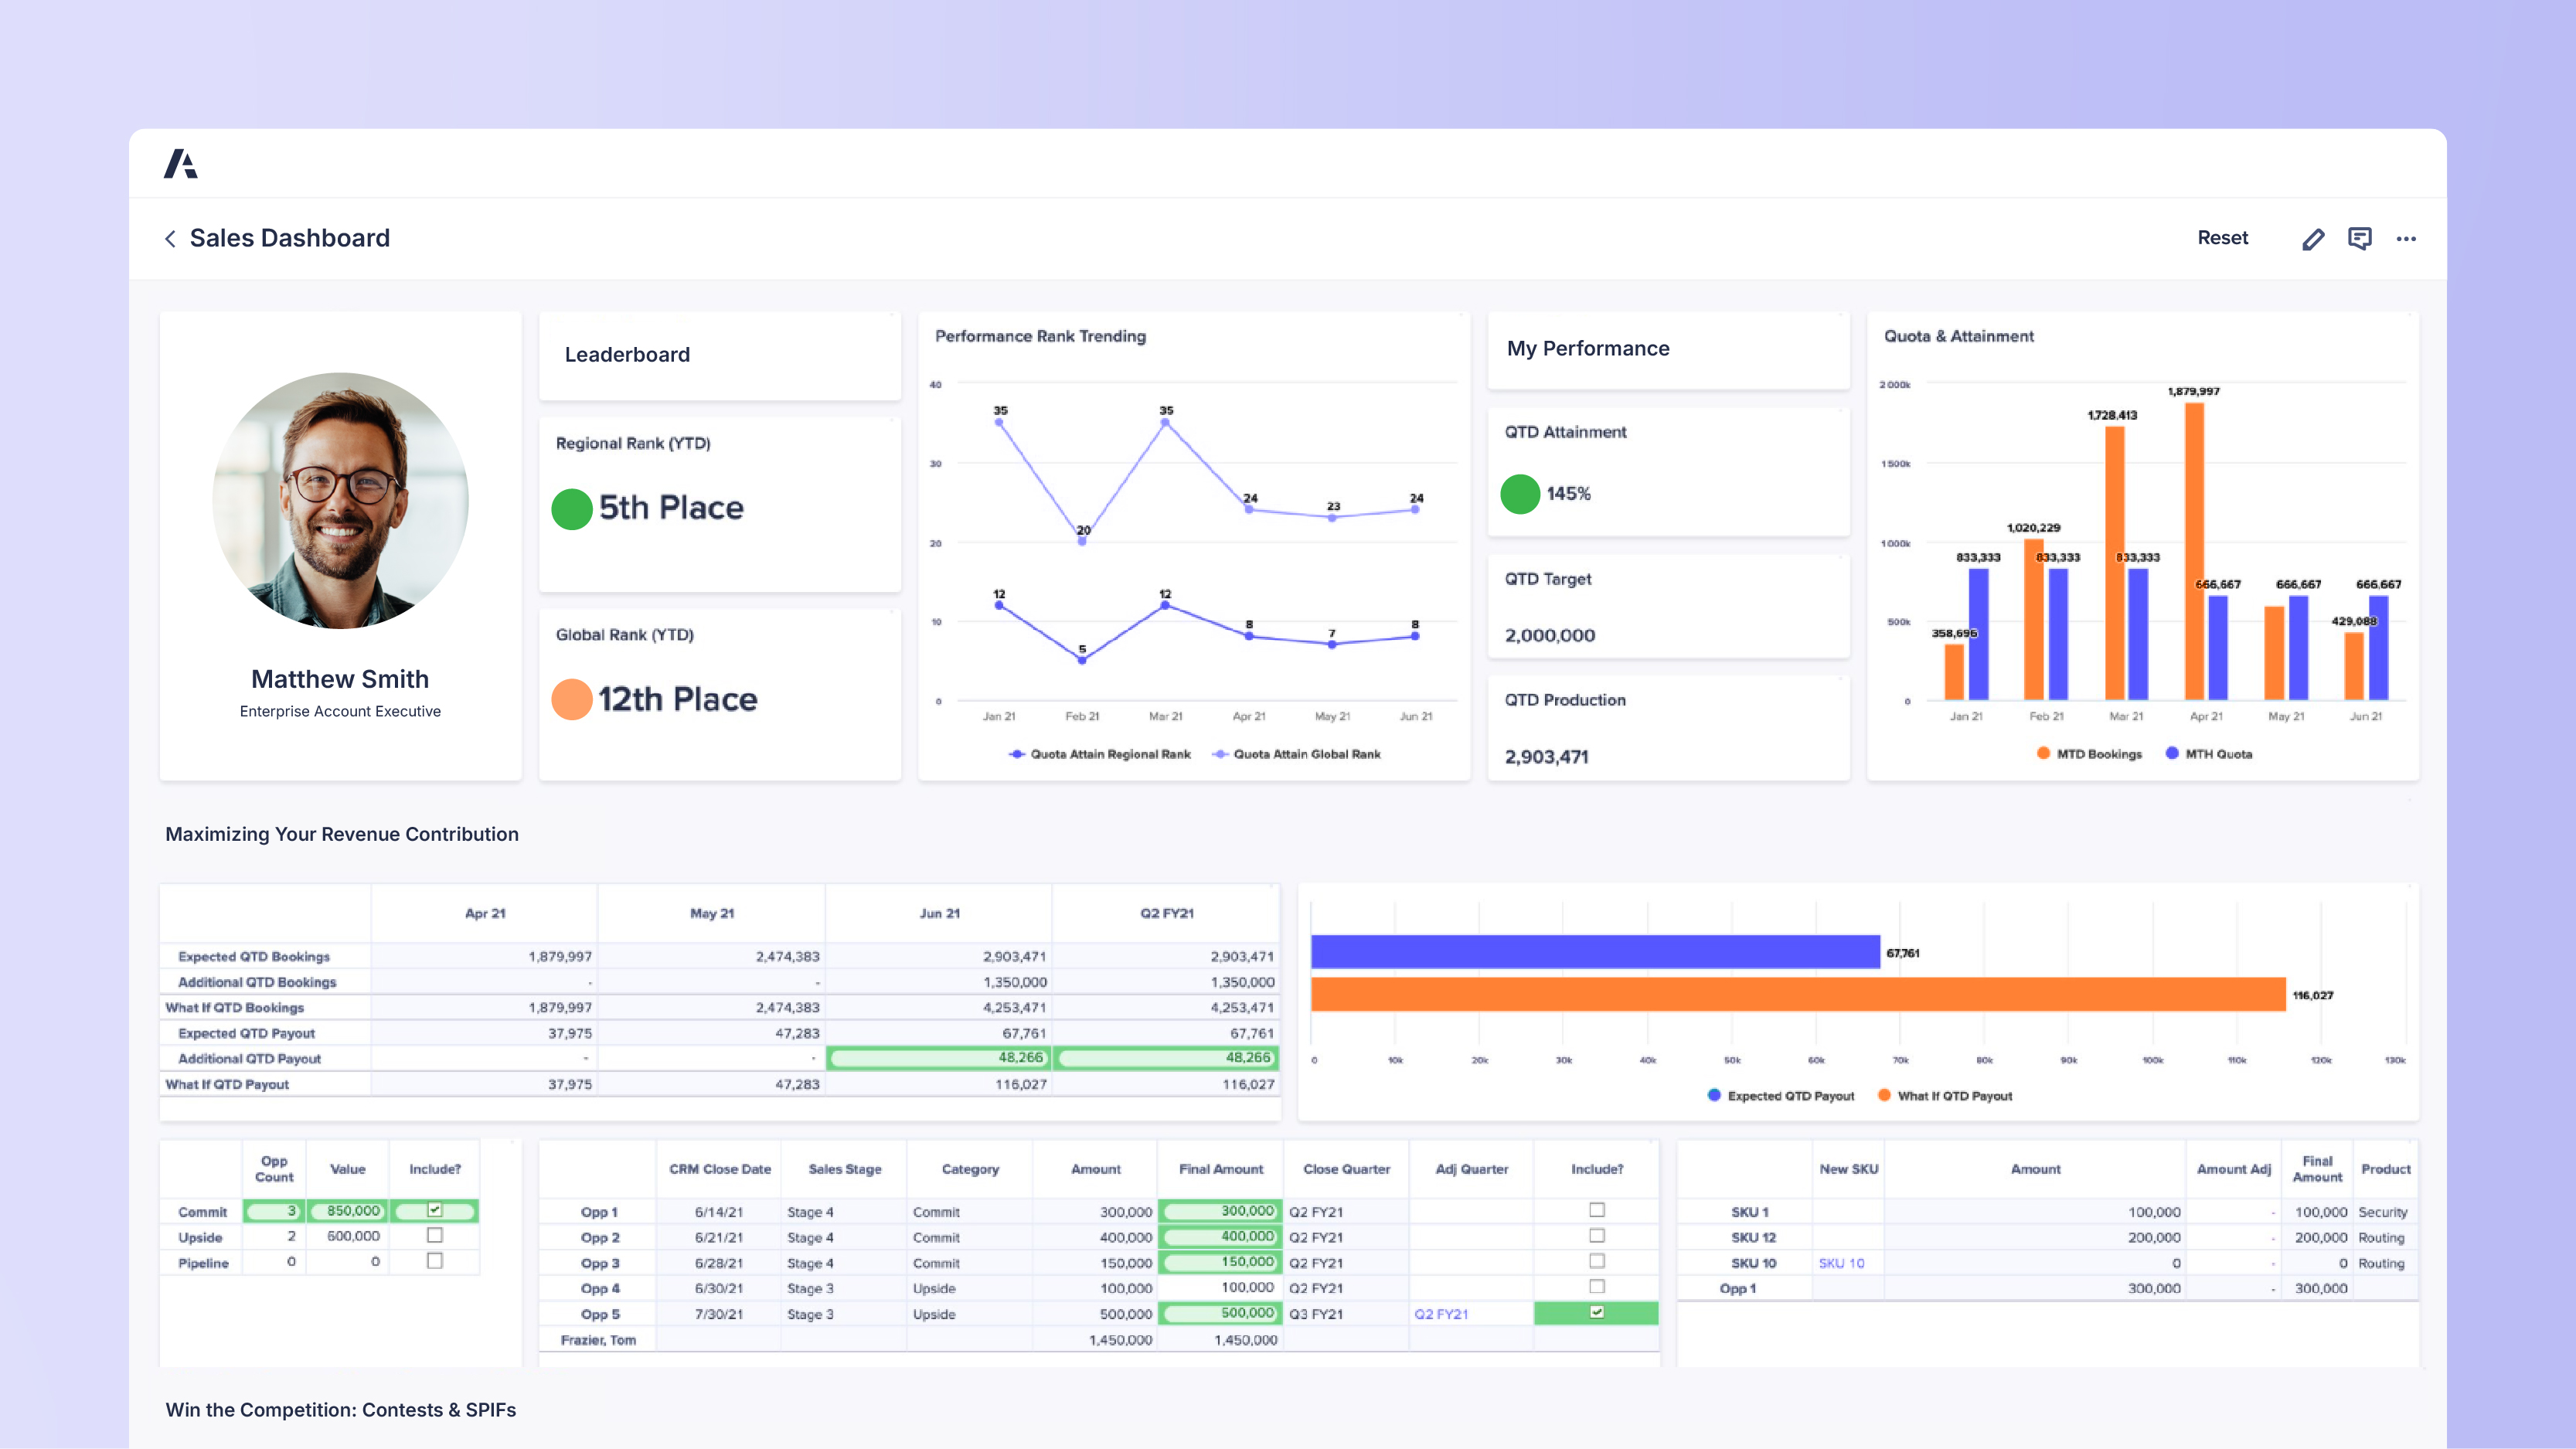
Incentivize growth and motivate GTM teams with agility and control
IDC MarketScape for Sales Performance Management 2025
Learn why Anaplan is an ideal choice for businesses “looking to break down departmental silos and create a single source of truth for enterprise-wide planning, especially when you need dynamic, agile planning capabilities that can quickly adapt to market changes and organizational restructuring.”

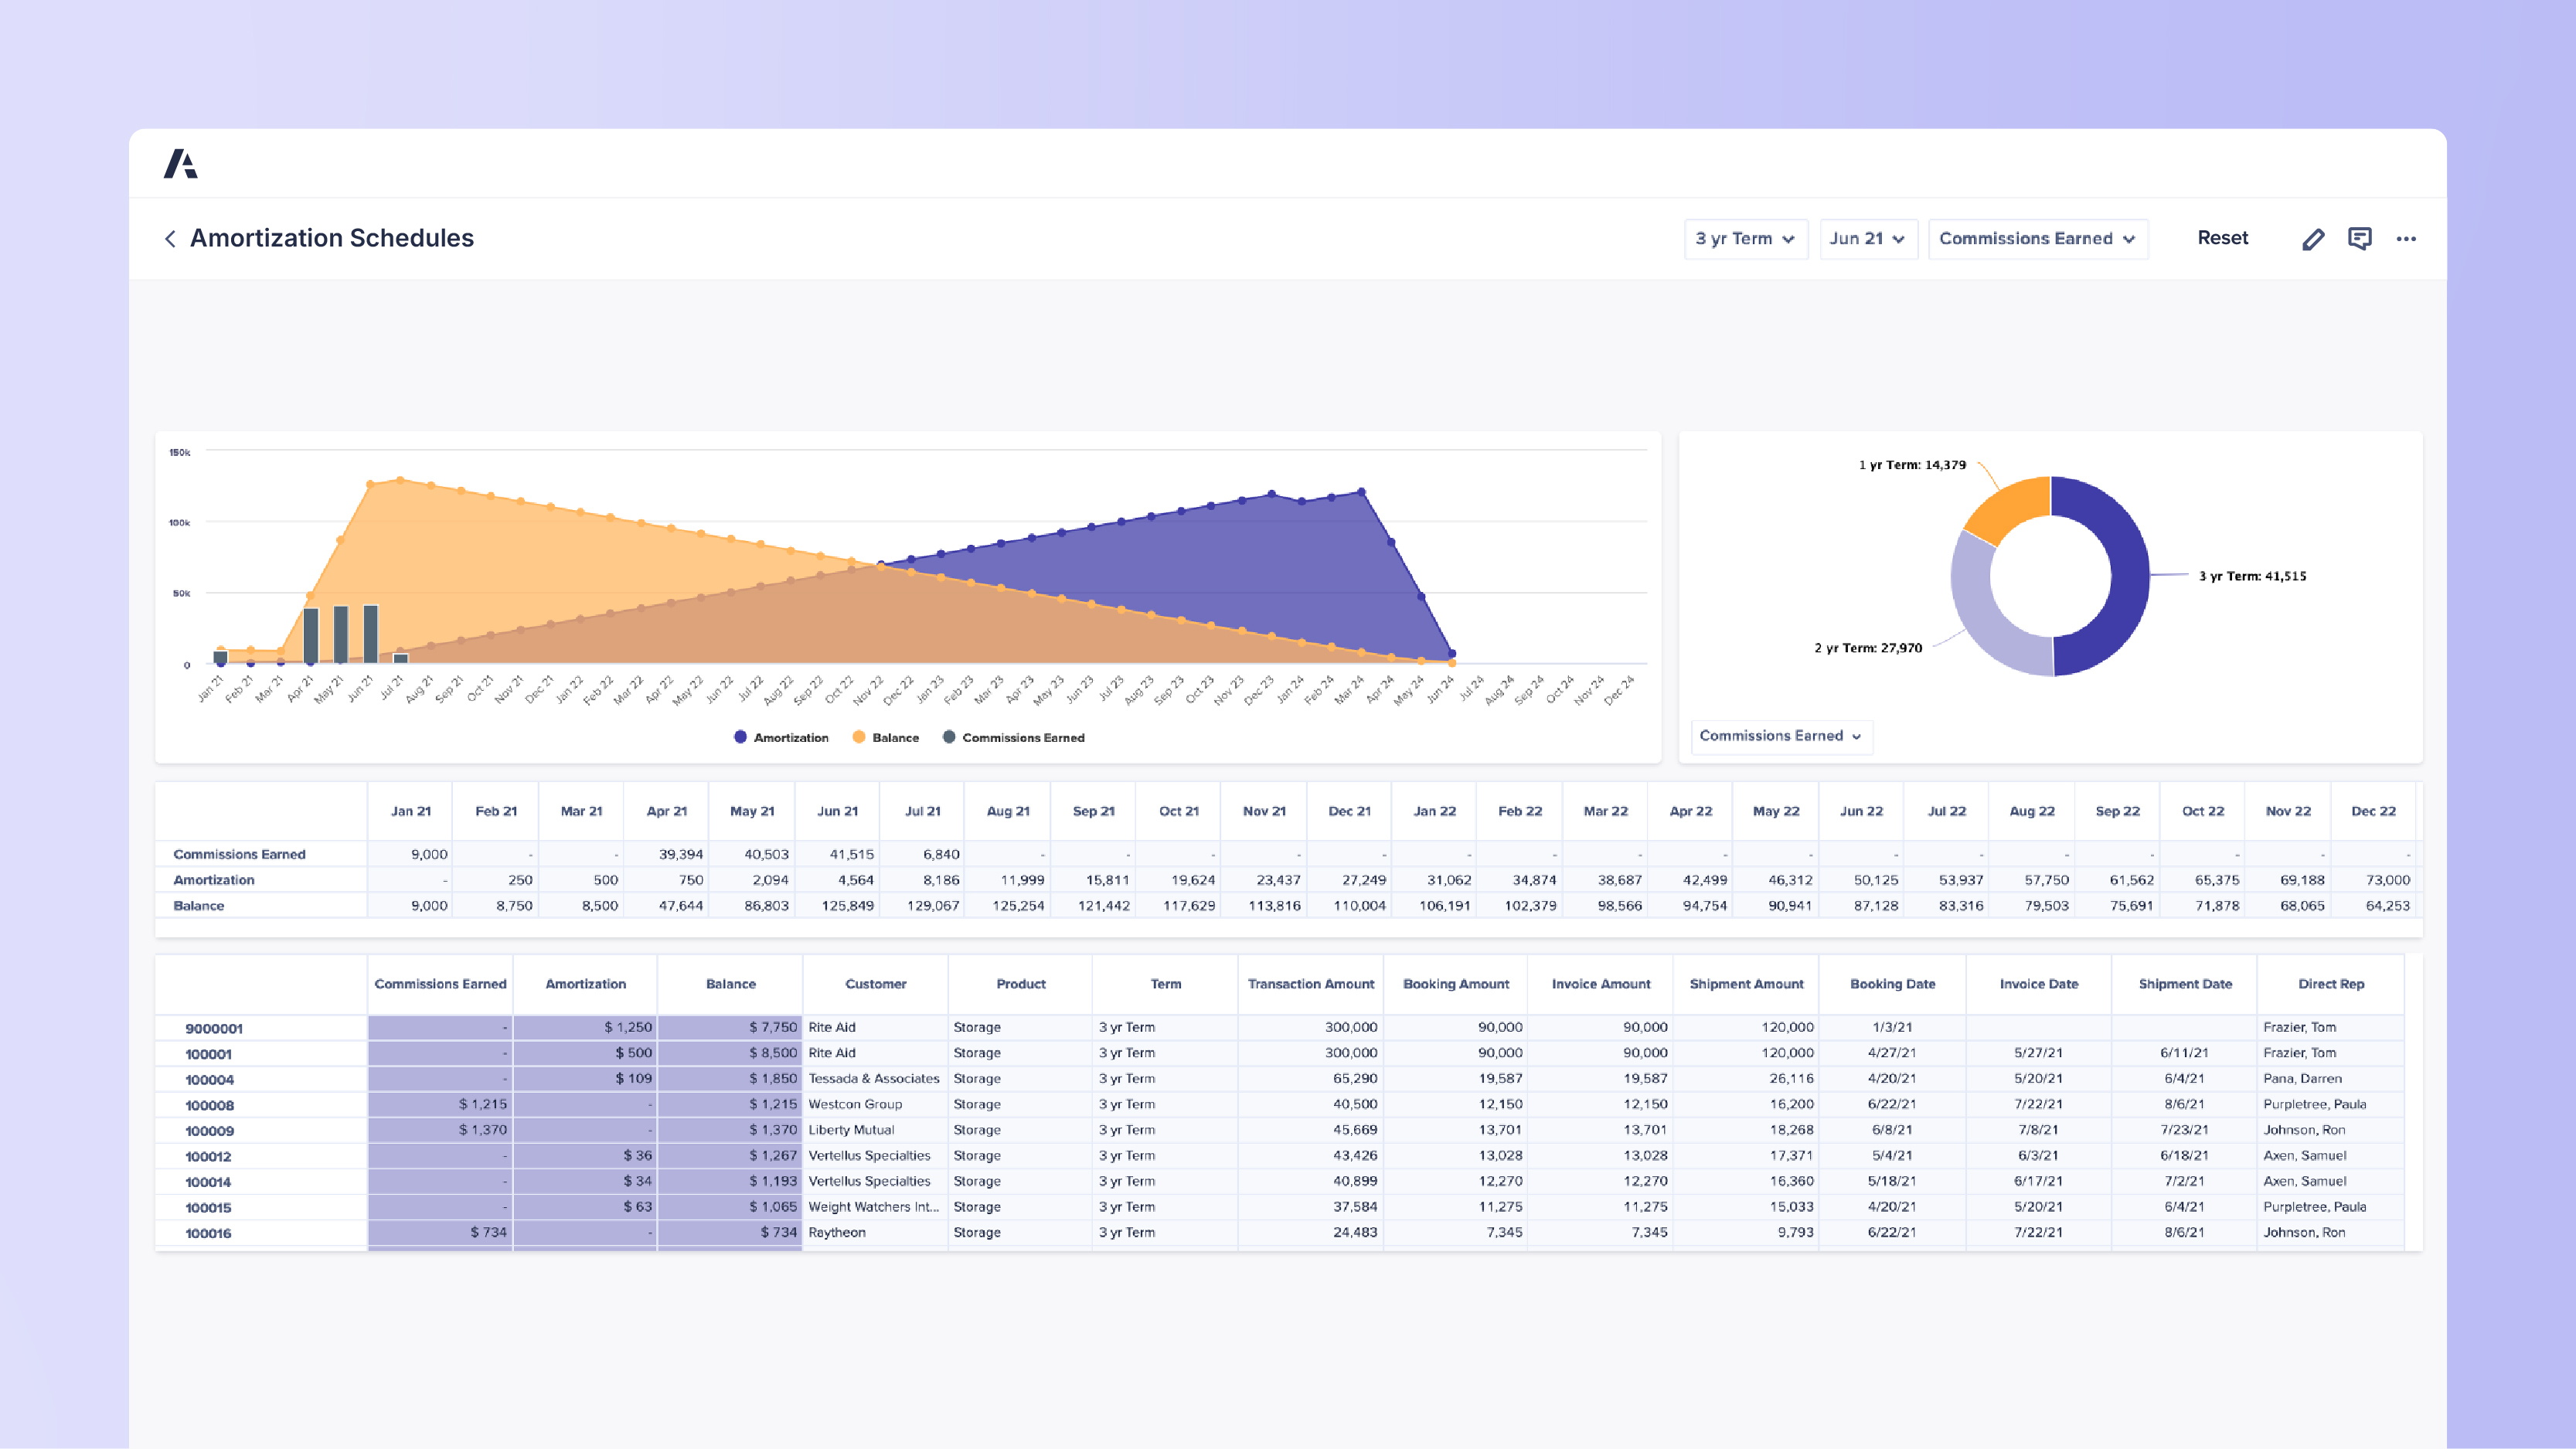
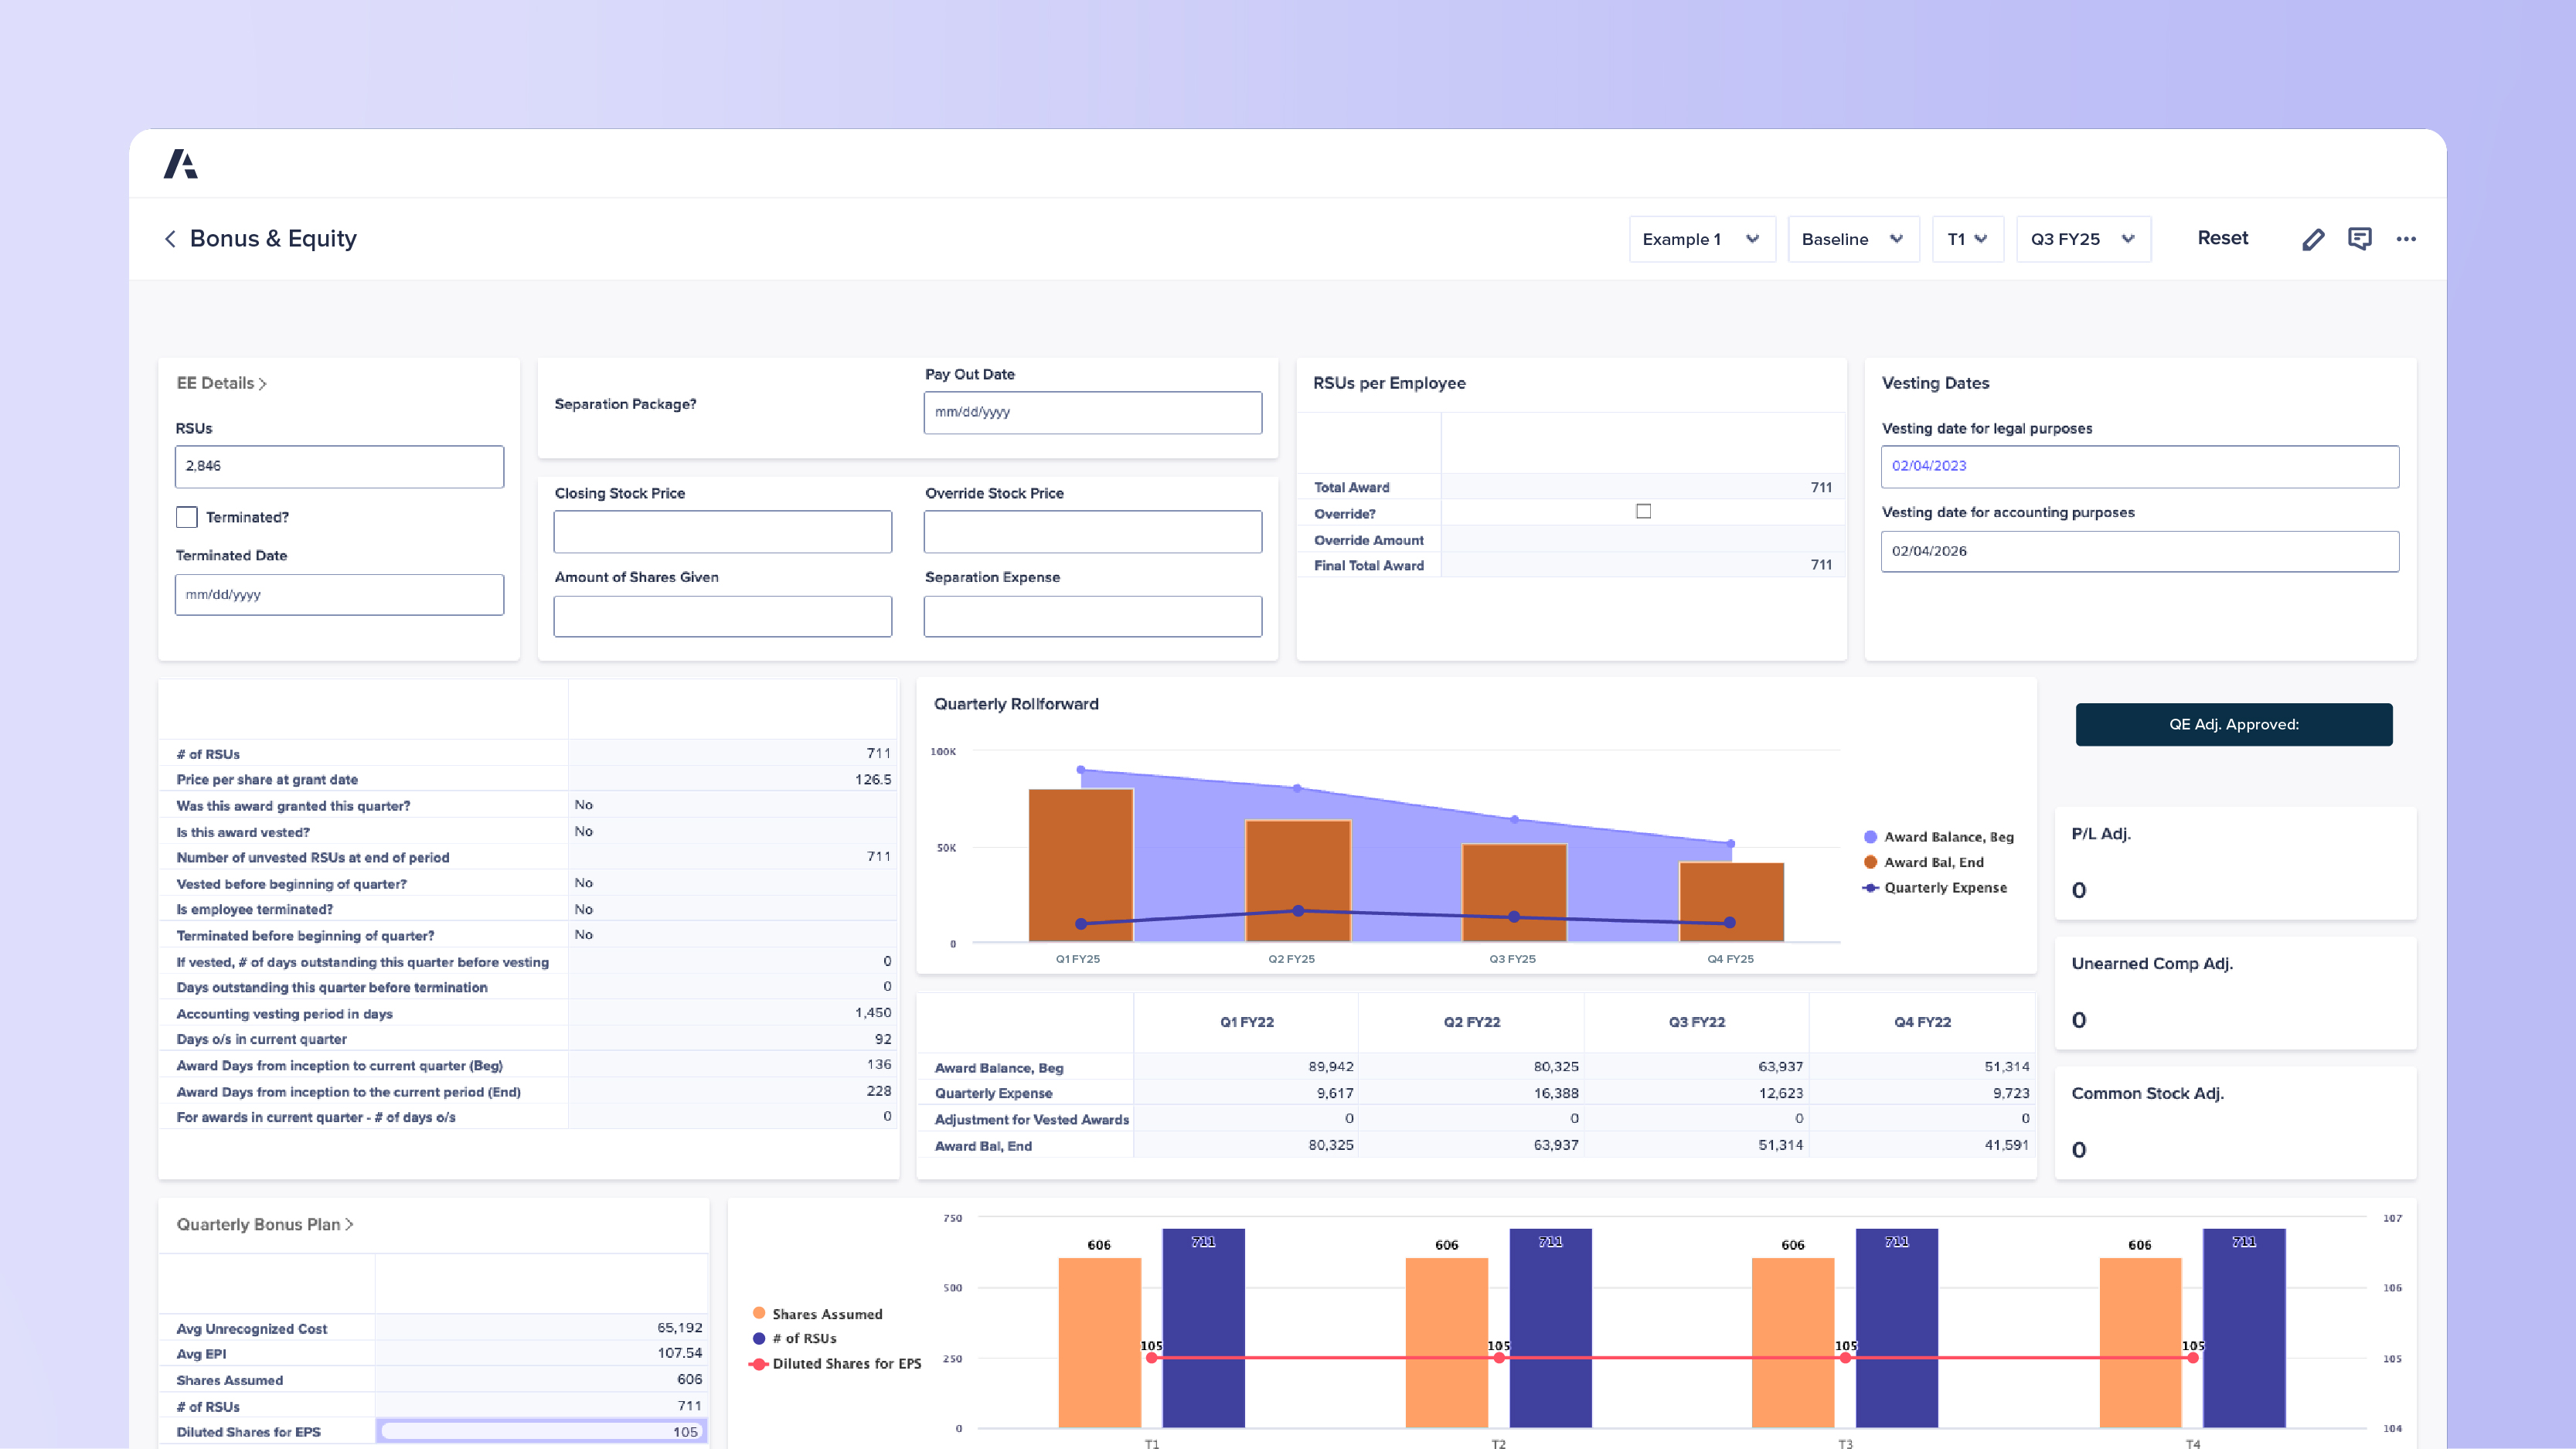
Boost productivity by assessing, designing, and administering incentives
Top GTM leaders plan with Anaplan
Featured resources
Best practices and valuable insights to enhance your incentive compensation and revenue performance management.


Discover the platform sales leaders trust.
Be the next.
Revenue and sales ops teams around the world rely on Anaplan to outpace the competition. Shouldn't you?
