Learn why connected enterprises drive higher shareholder returns
Marketing performance management
Align strategy and resources. Optimize marketing decisions.
AI-driven planning, analysis, and reporting solutions for marketing performance management.
Transform marketing from a cost center to a growth driver
Go from reactive reporting to proactive marketing performance management with a single platform connecting your plans, resources, budget, and results.
2025 ISG Research Revenue Performance Management Buyers Guide
Learn why Anaplan is again named a leader in RPM, ICM, and SPM and how - with Anaplan's comprehensive platform and AI-driven insights - you can align your GTM teams, optimize your strategy, and drive growth.

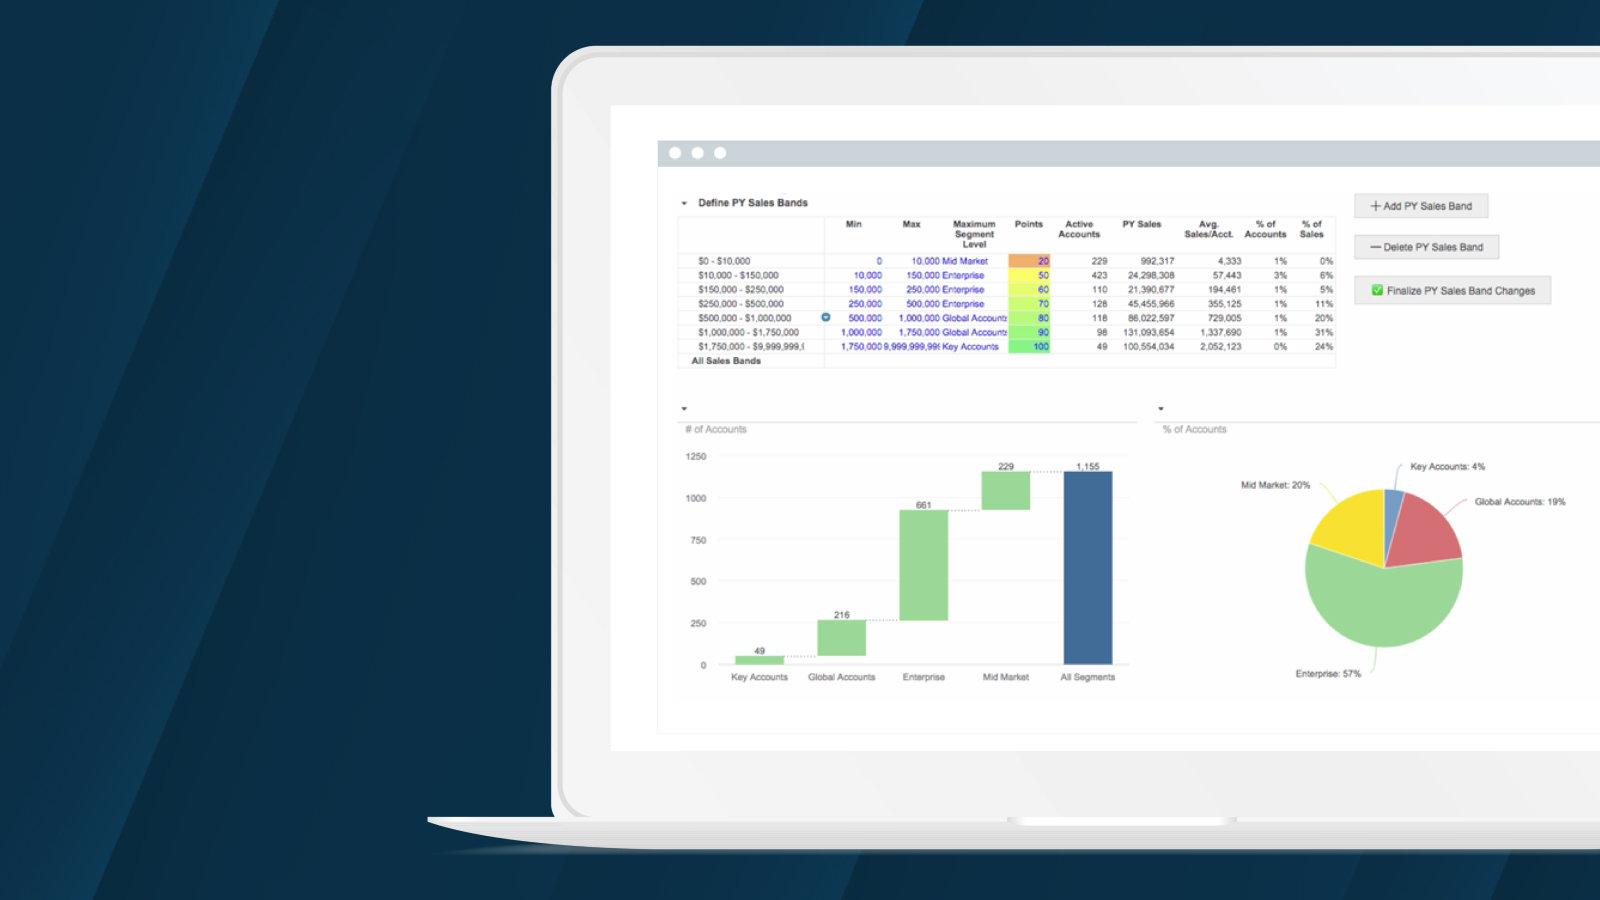
Gain a complete view of your marketing performance
Anaplan provides a comprehensive suite of capabilities to connect your entire marketing organization — from financial governance to strategic planning and performance insights.
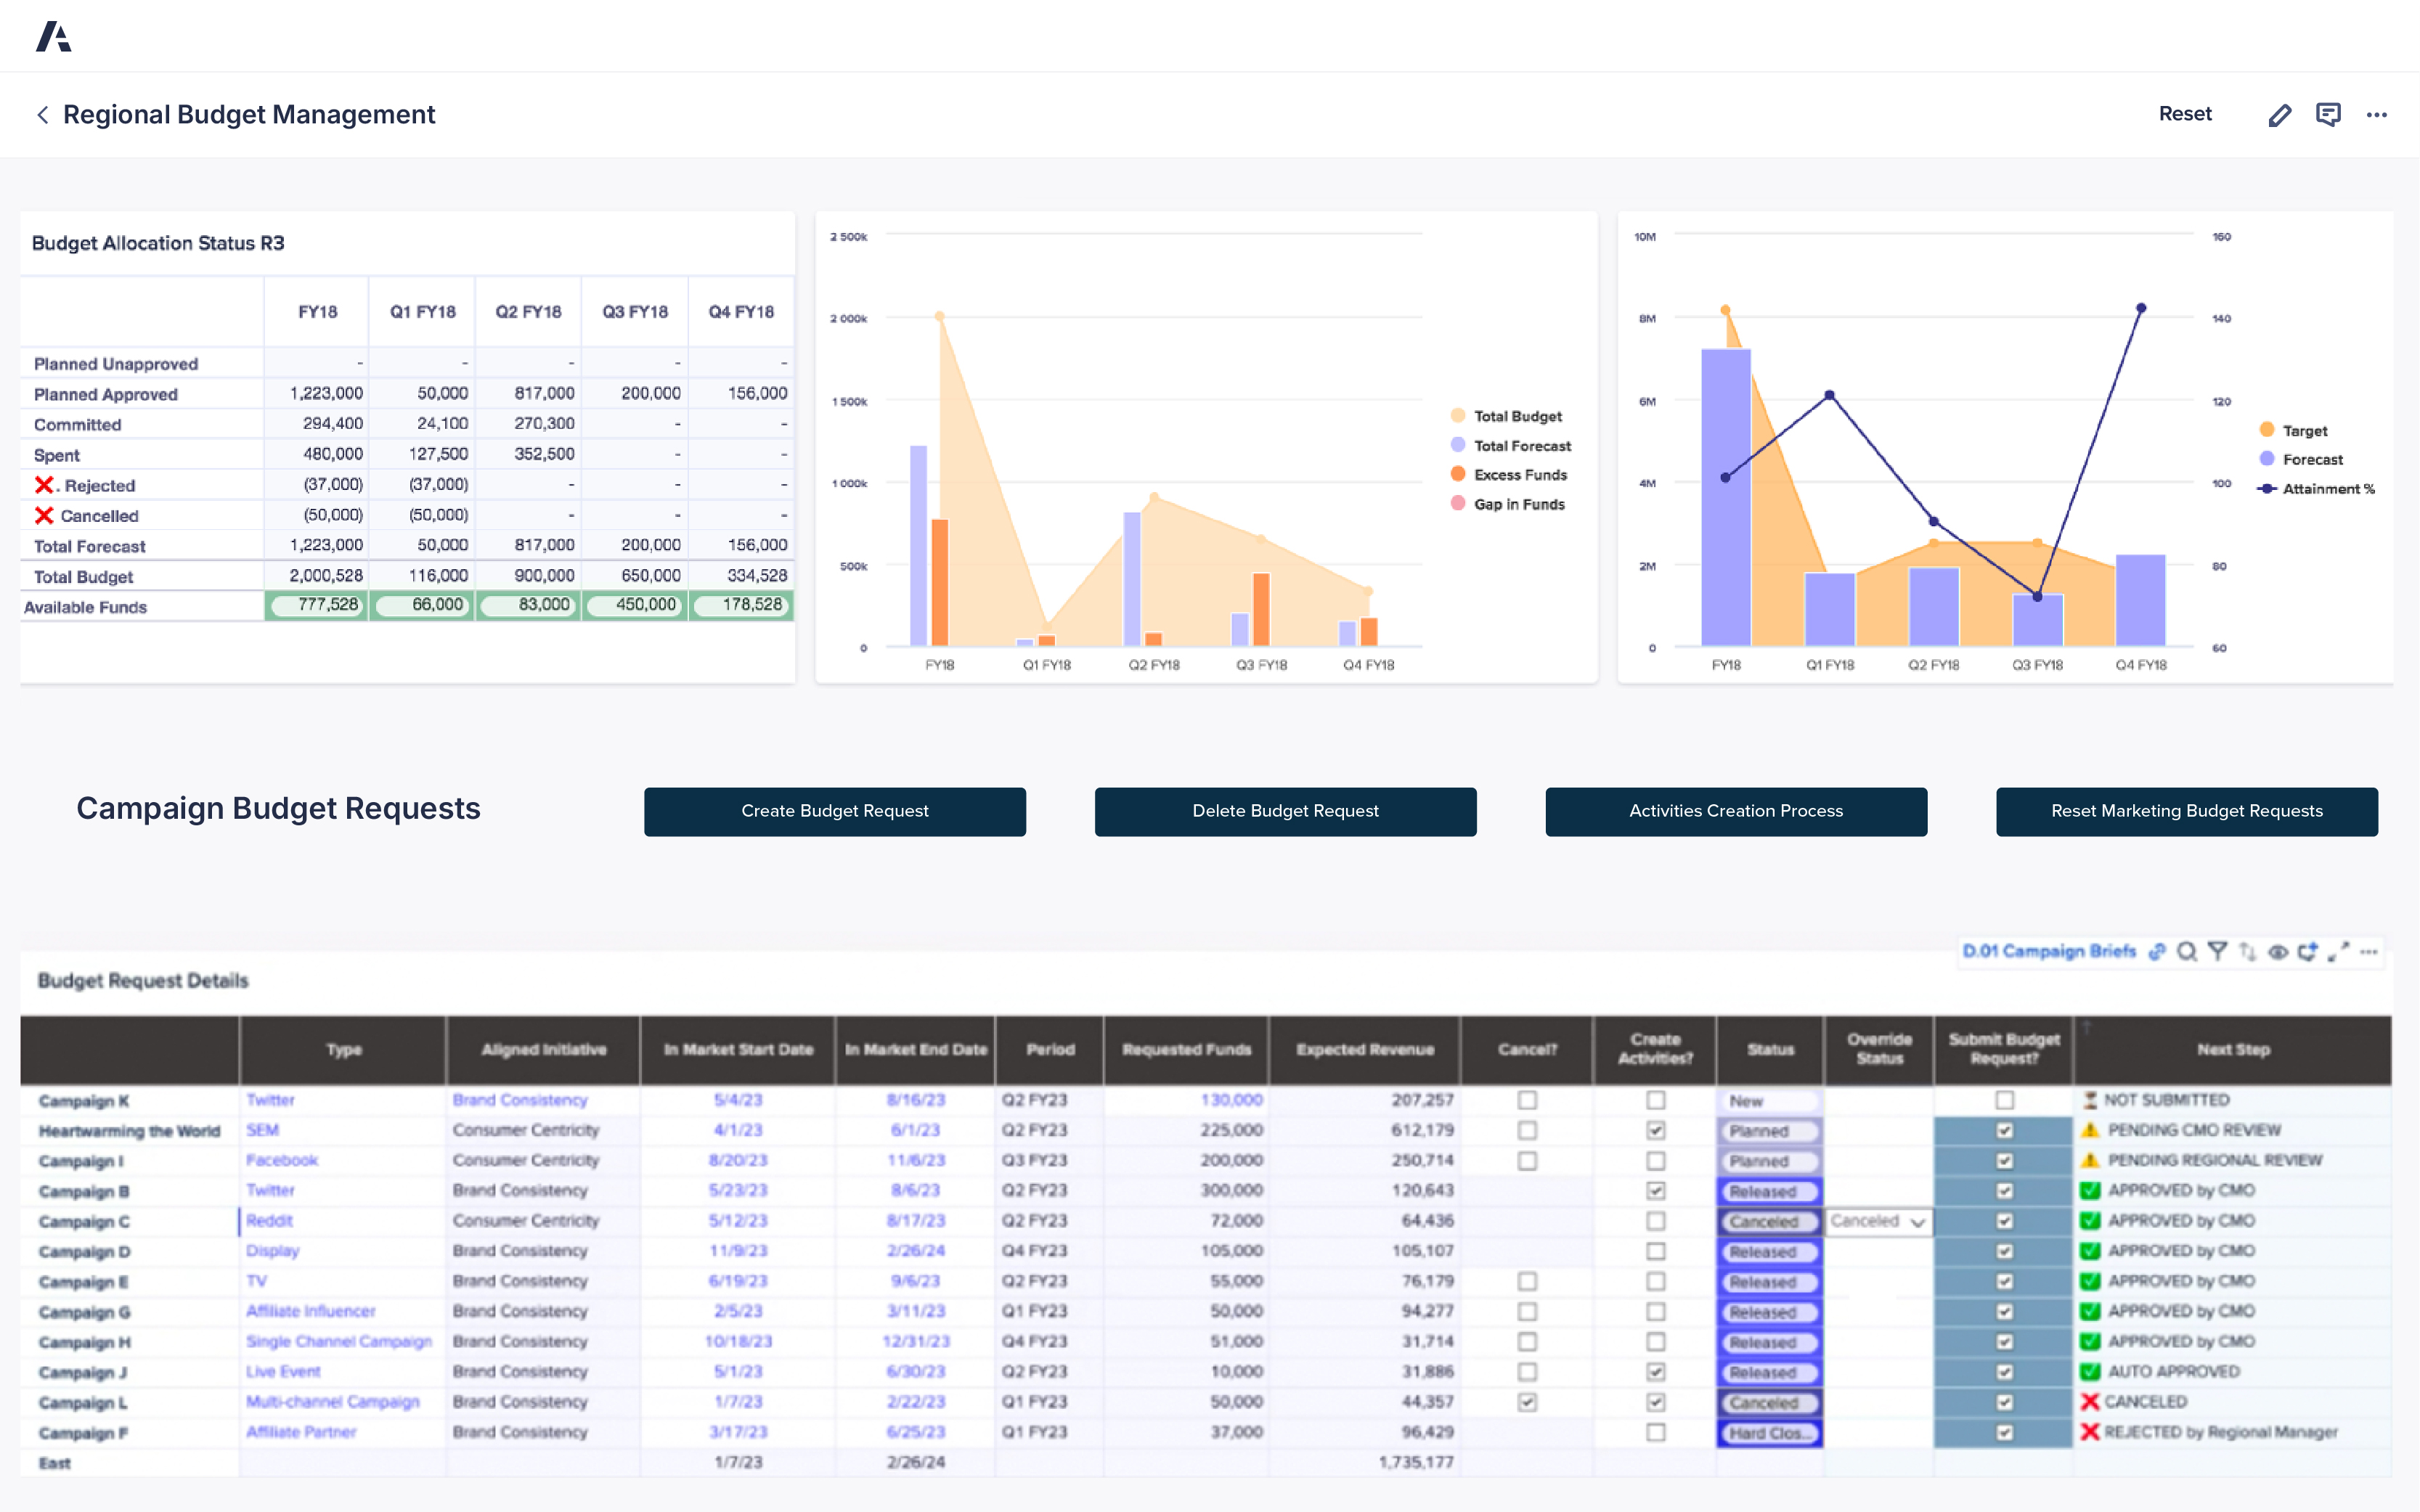
Marketing finance
Instill financial discipline and connect every dollar of spend to business outcomes.
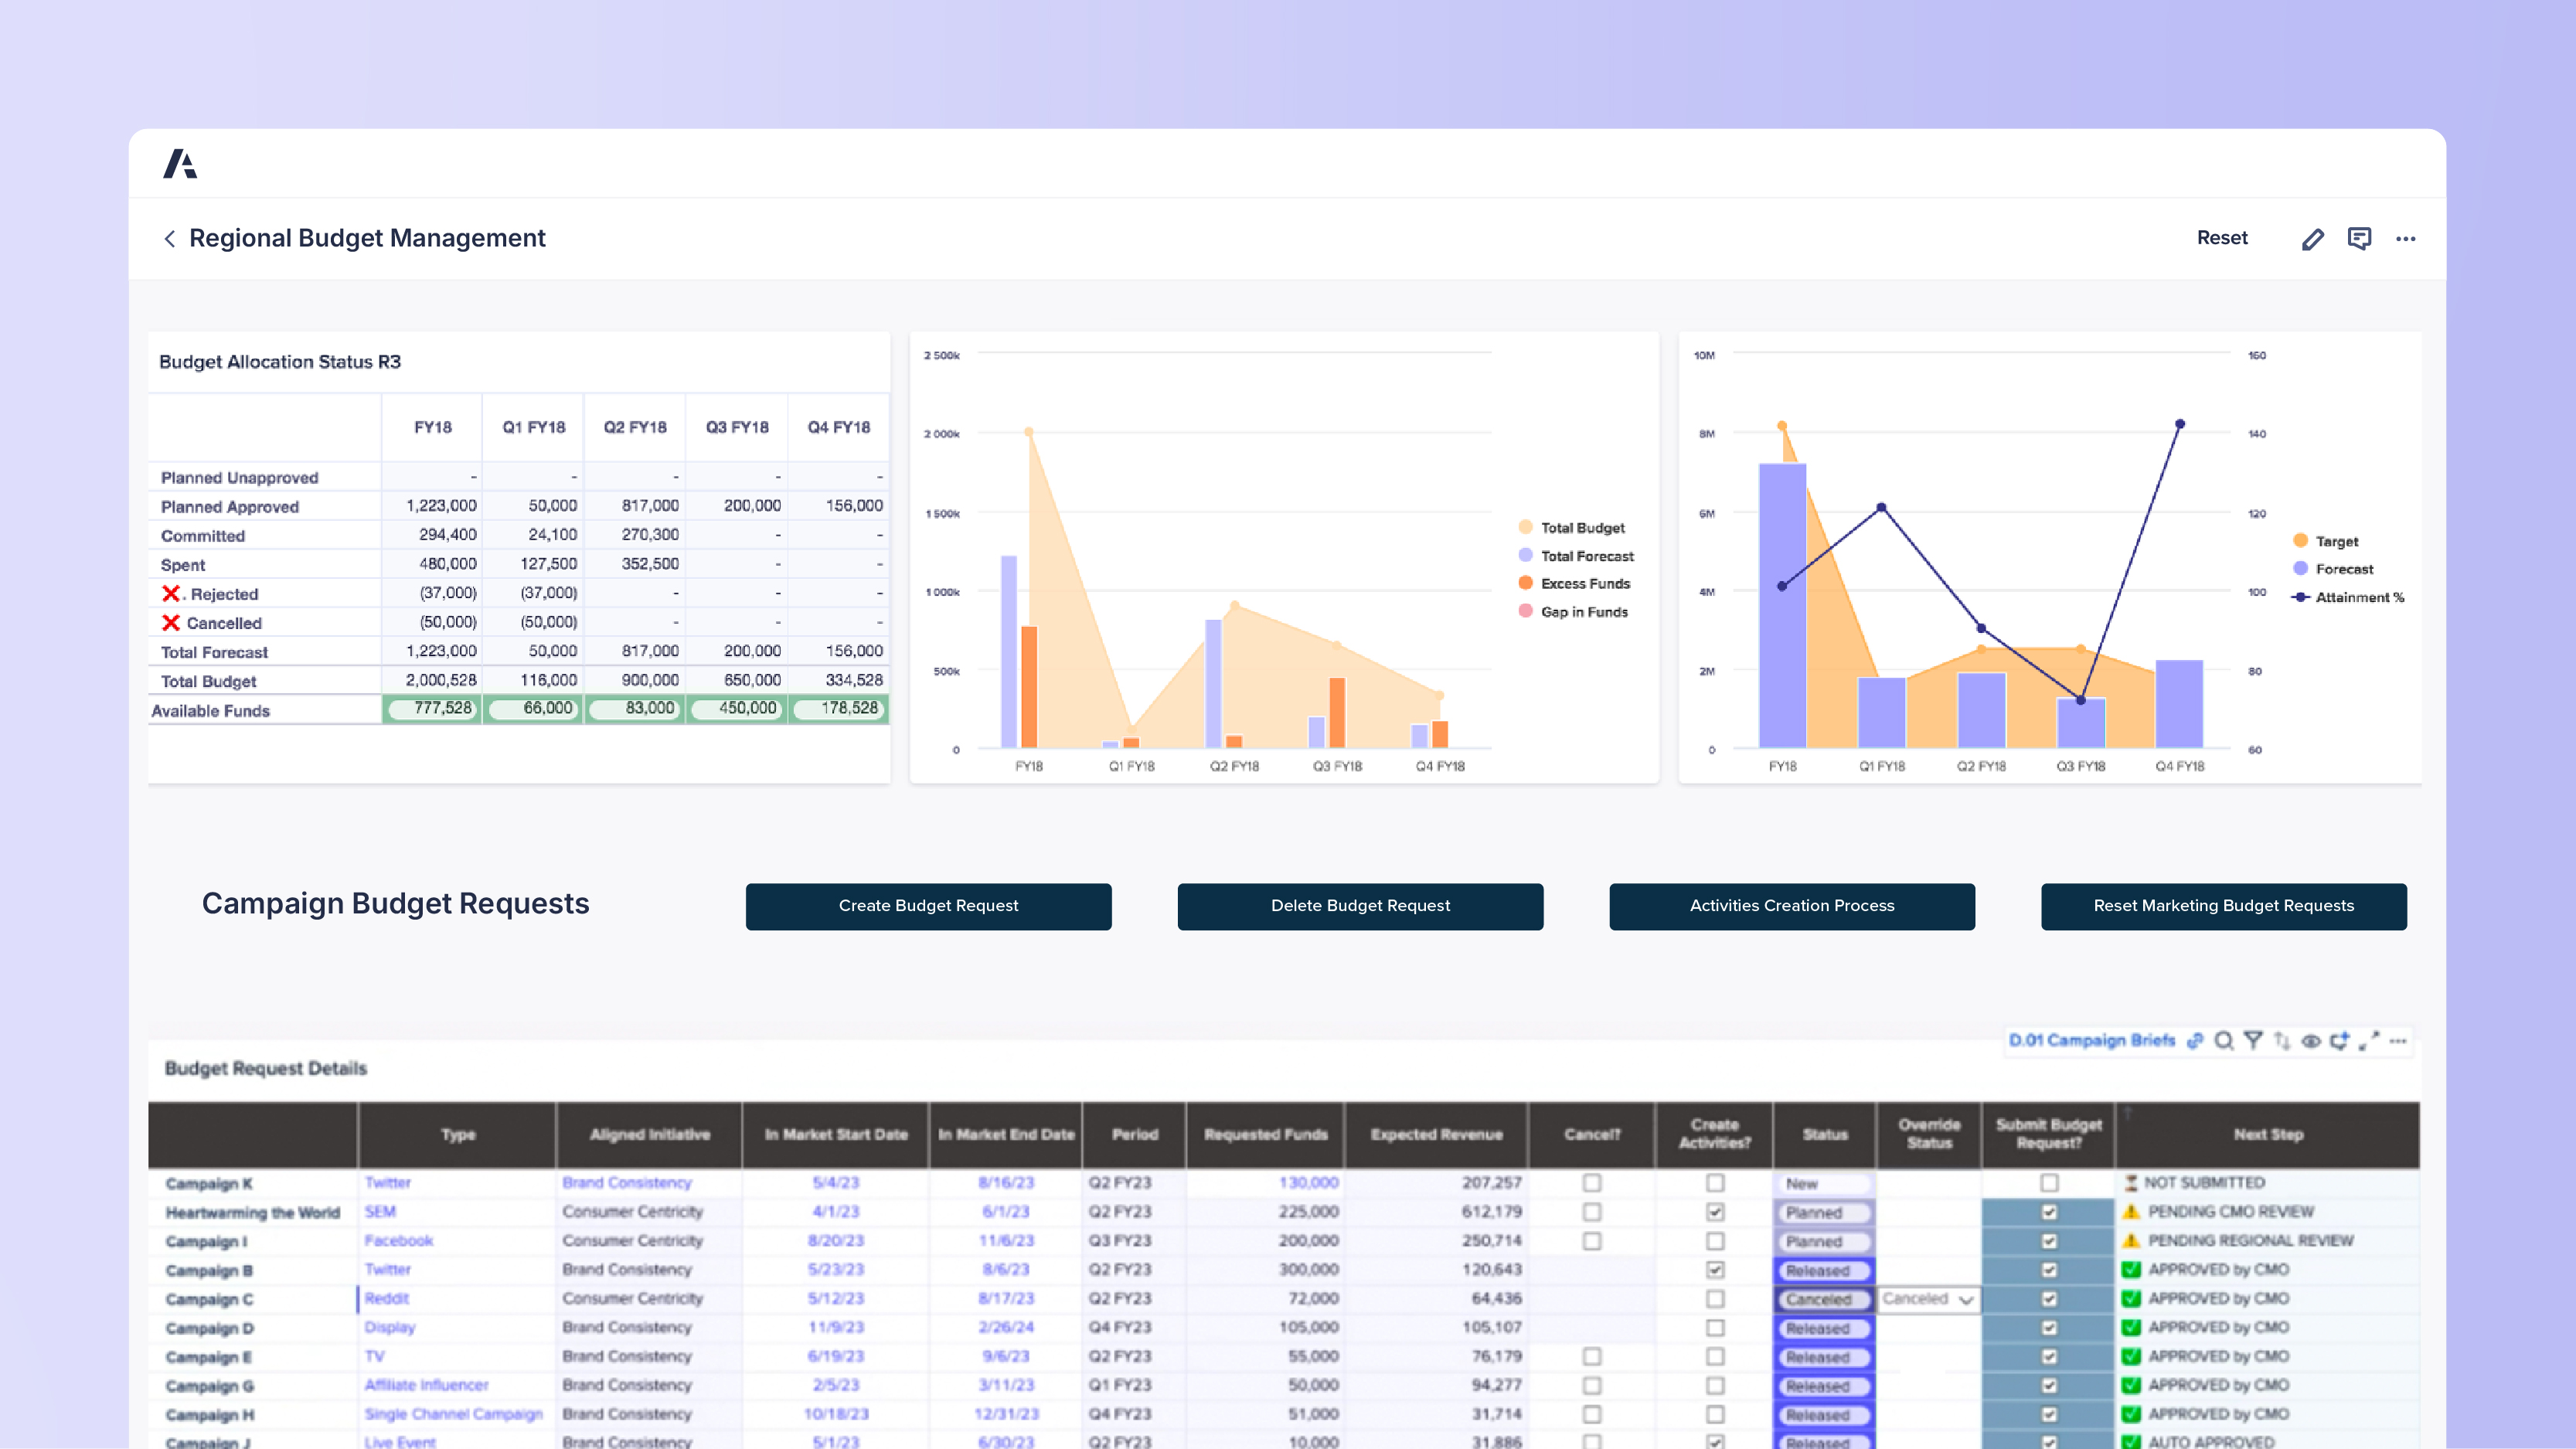
Marketing planning
Plan and execute more campaigns, programs, and activities with dynamic workflows and approvals.
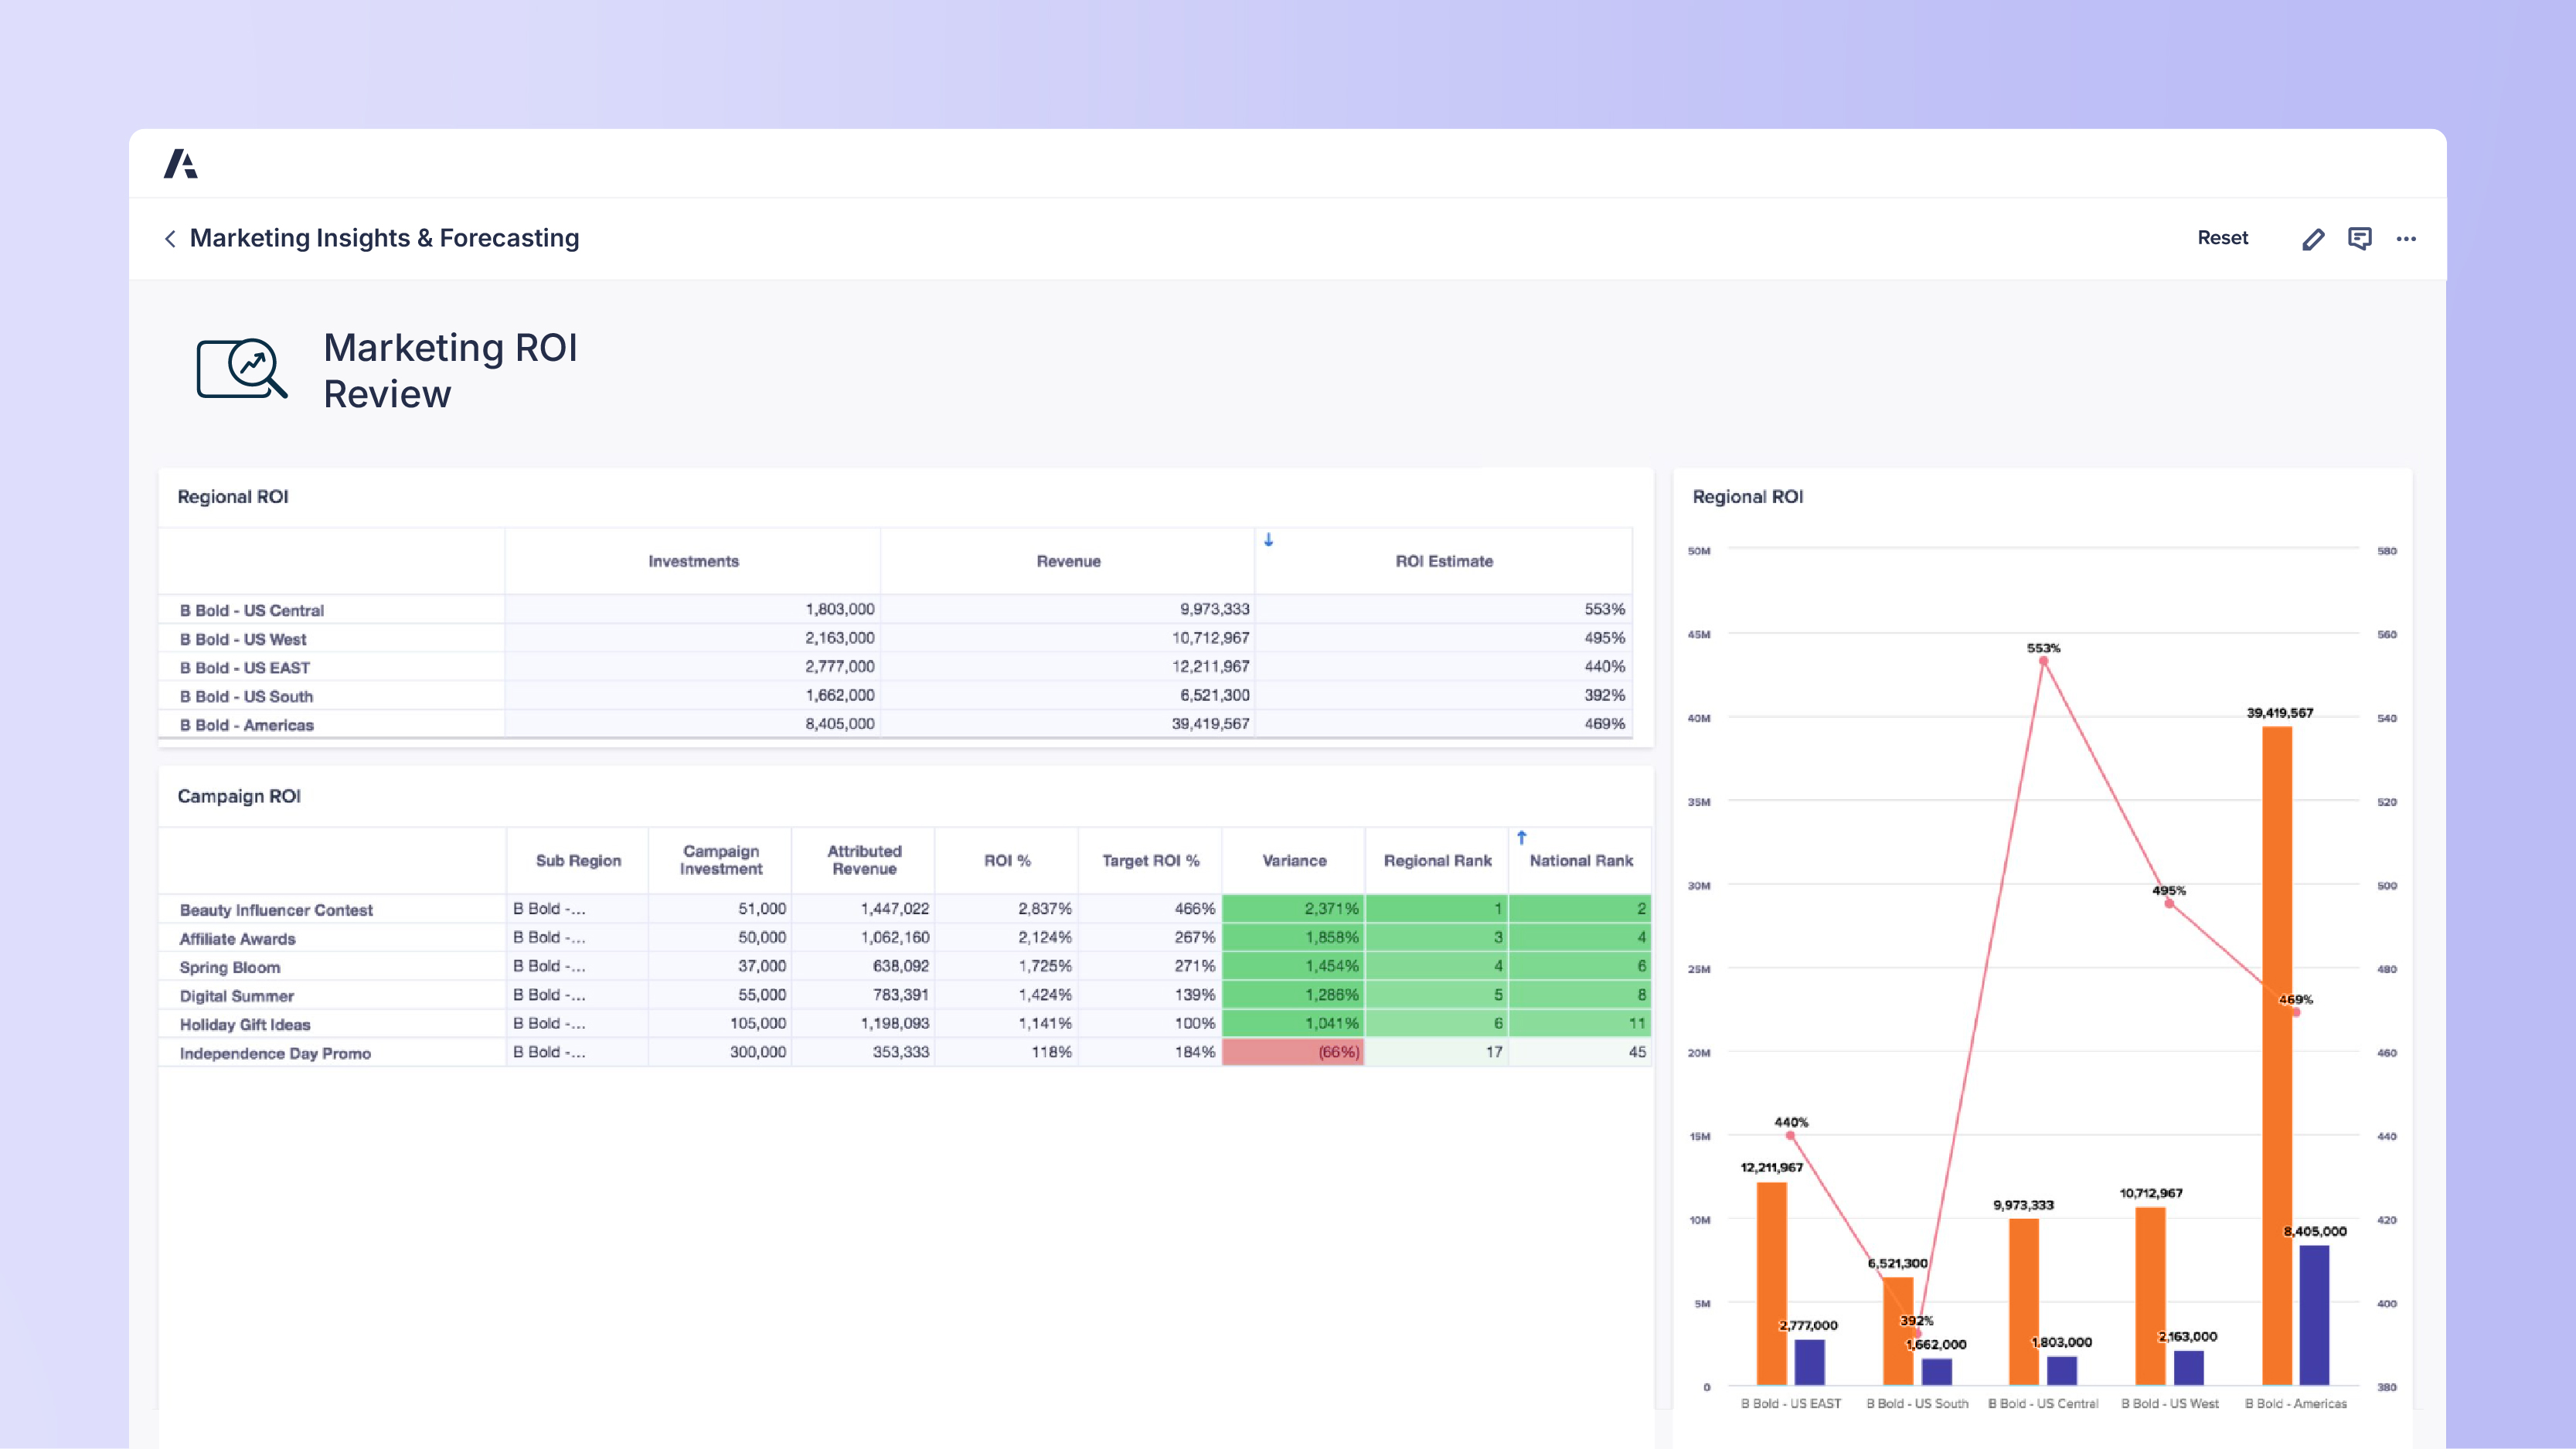
Marketing insights and forecasting
Move from reactive reporting to closed-loop marketing with proactive, data-driven decision-making.
Top marketing leaders plan with Anaplan
Featured resources
Best practices and valuable insights to help you optimize and accelerate your marketing performance management.


Discover the platform marketing leaders trust.
Be the next.
Marketing teams around the world rely on Anaplan to build a modern, connected enterprise. Shouldn’t you?
